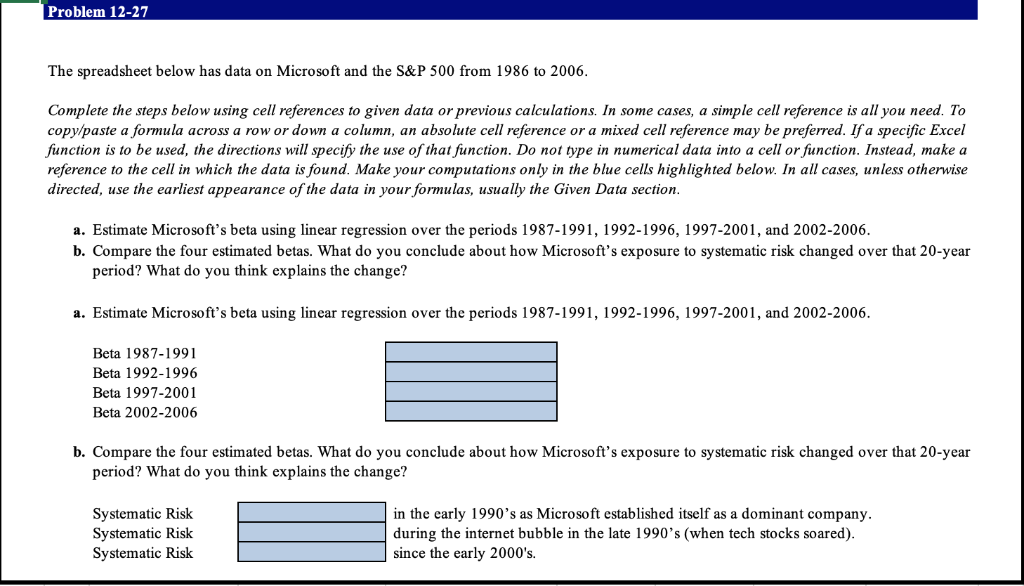
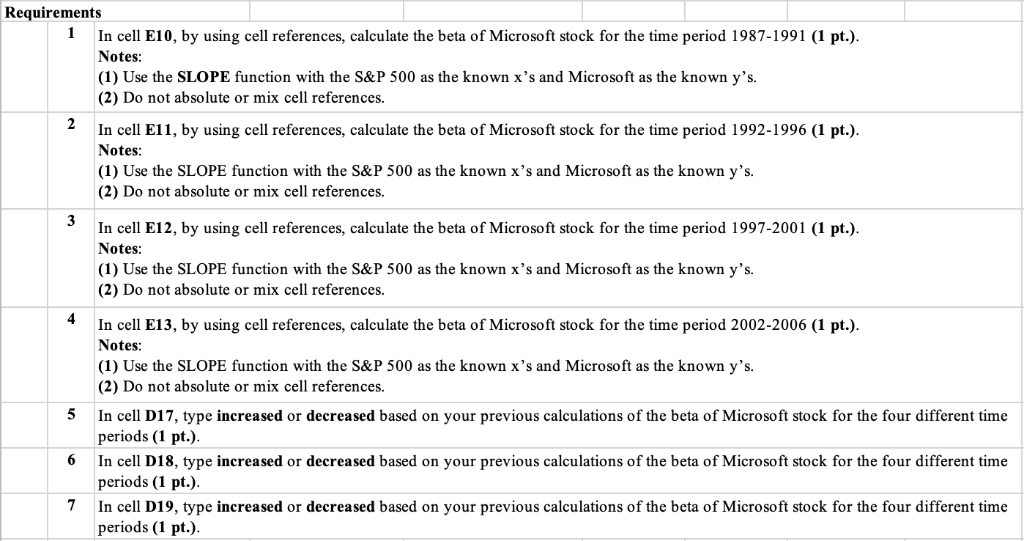
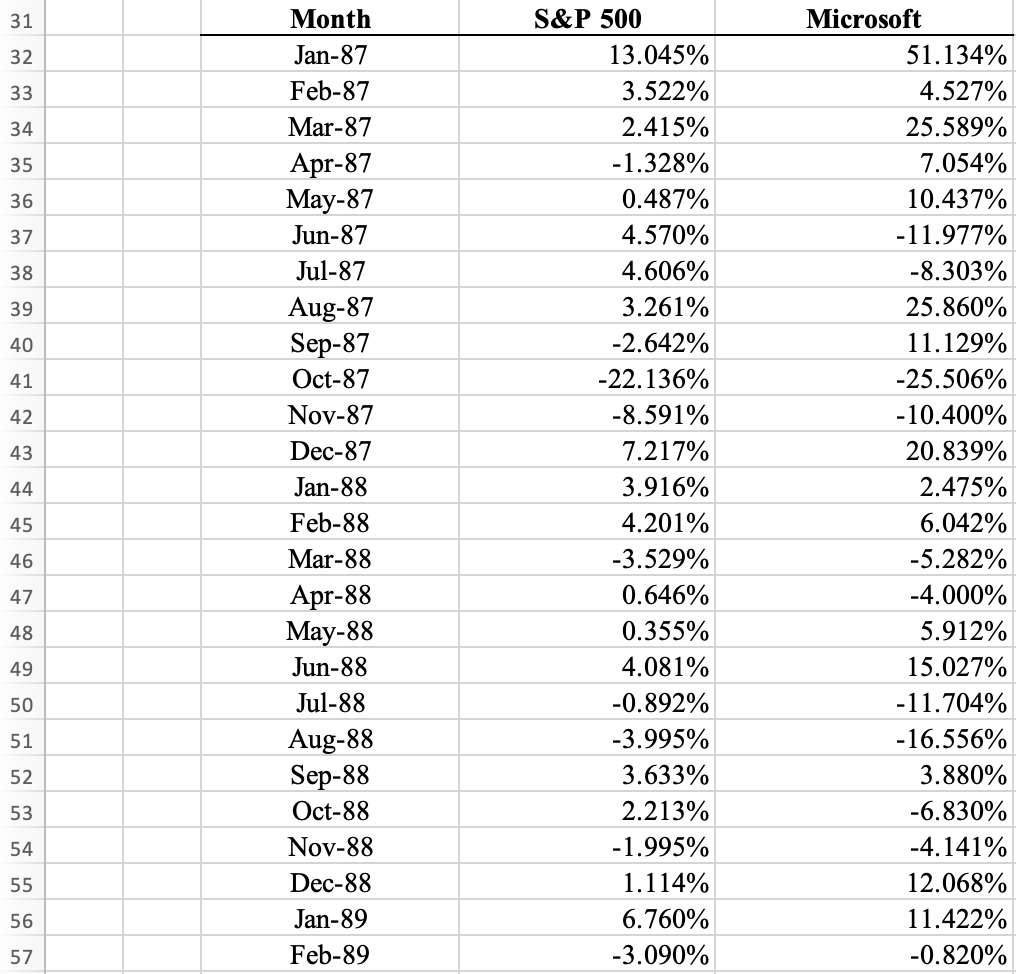
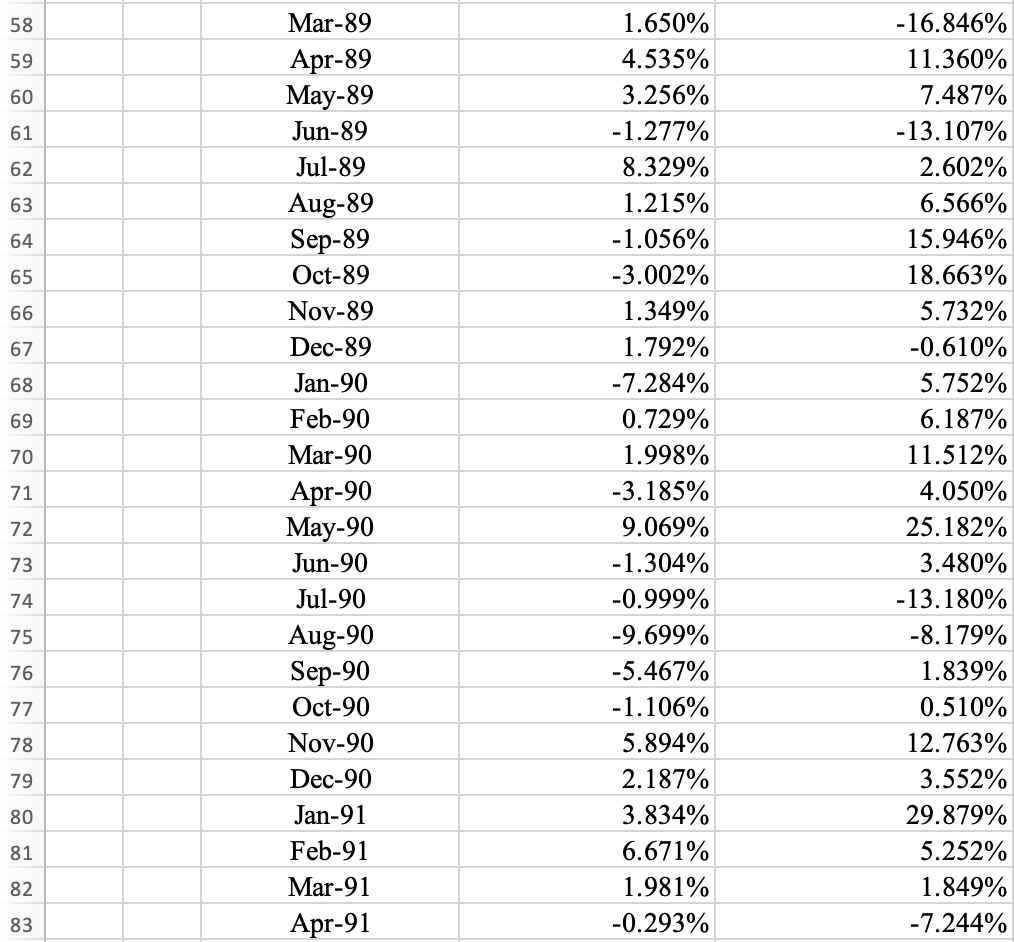
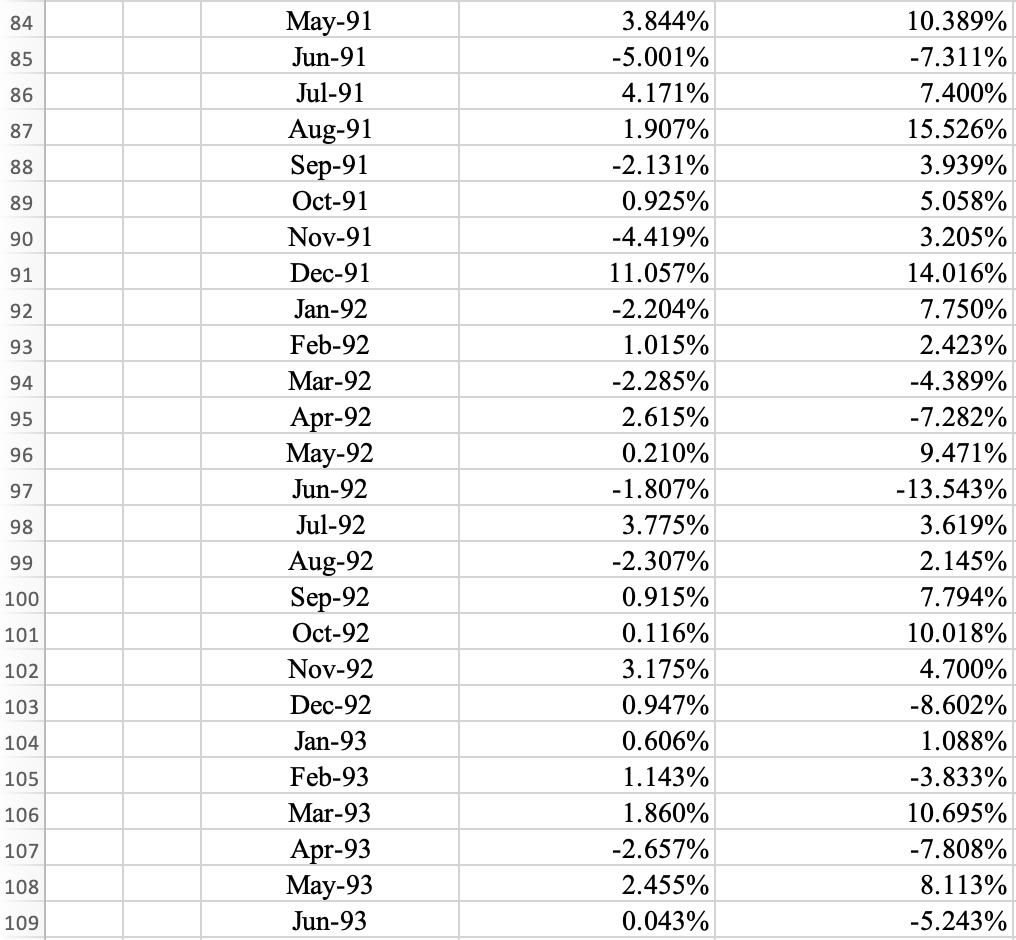
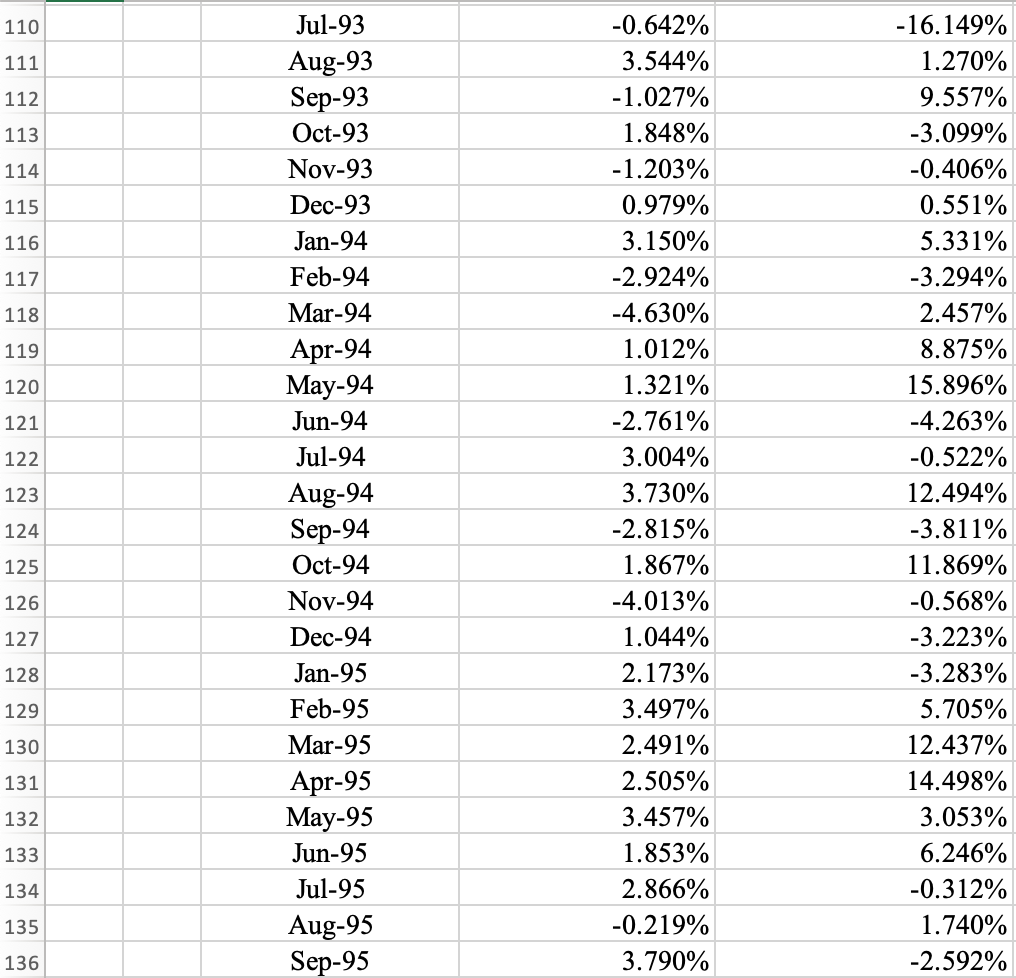
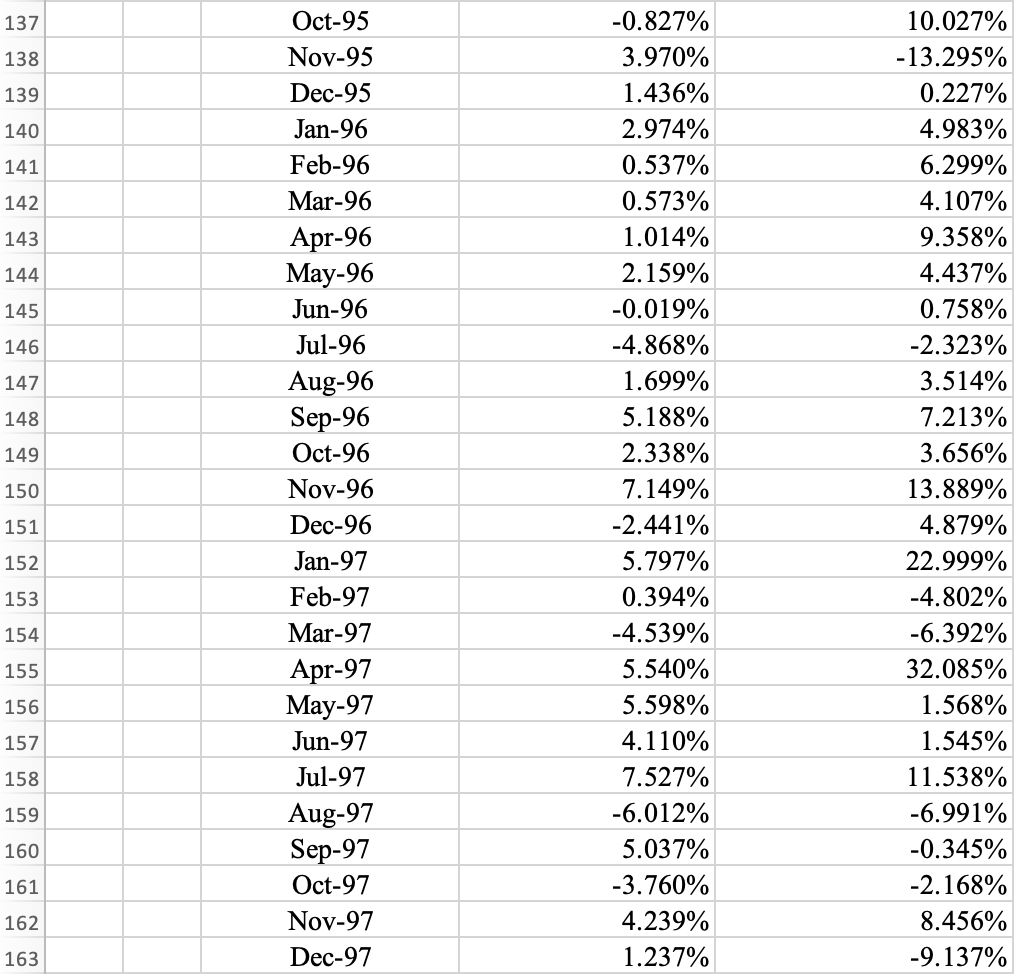
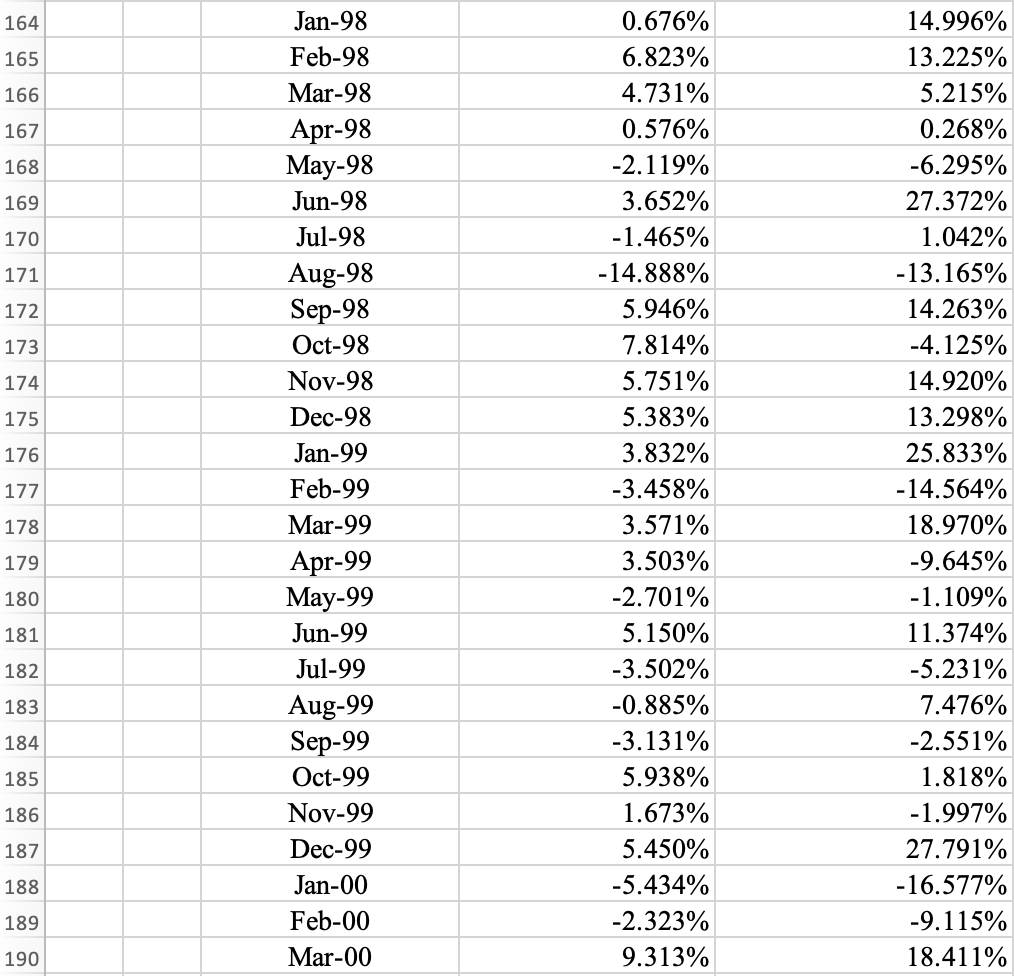
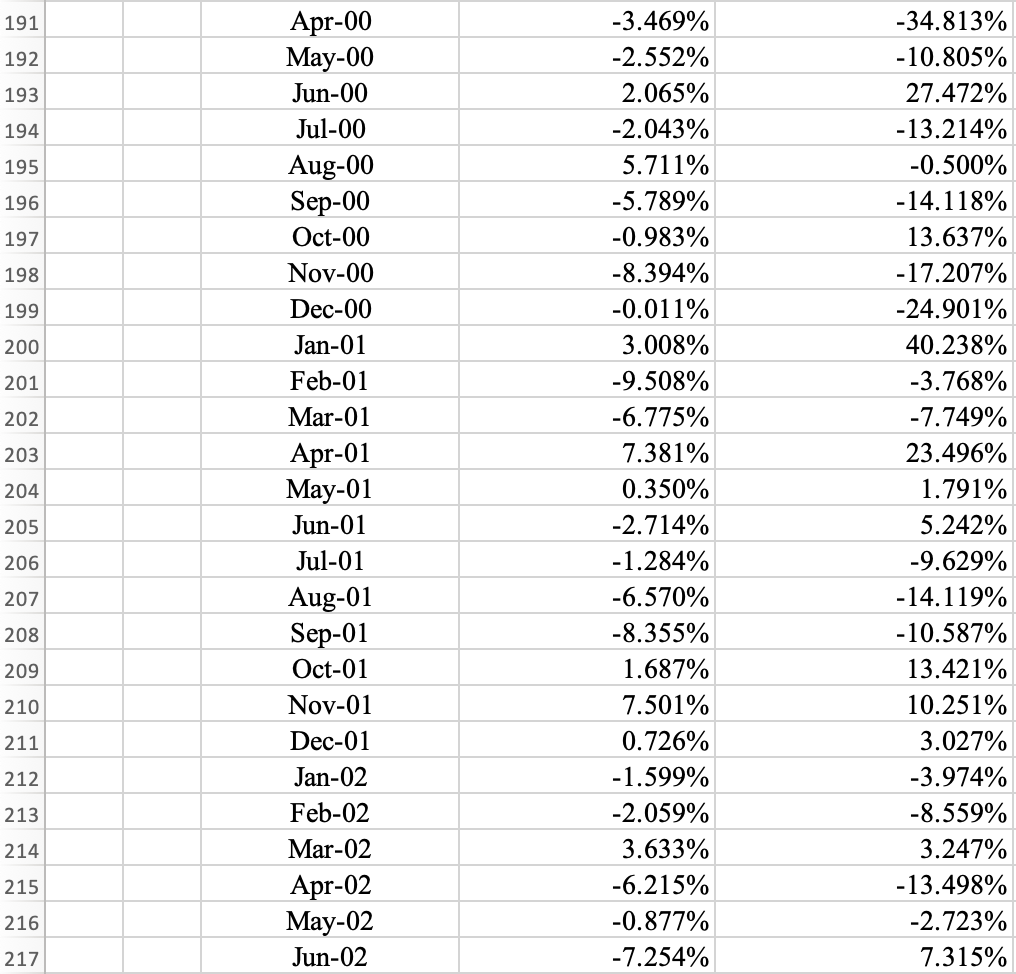
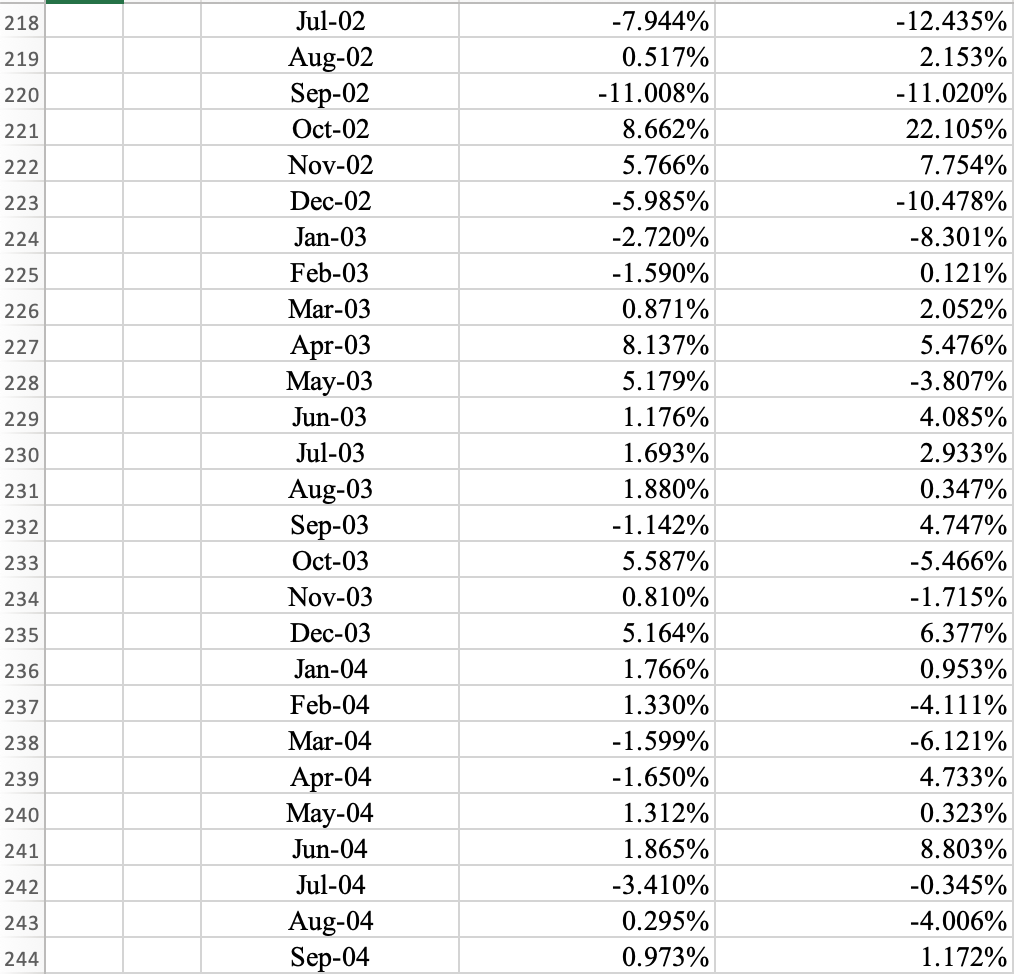
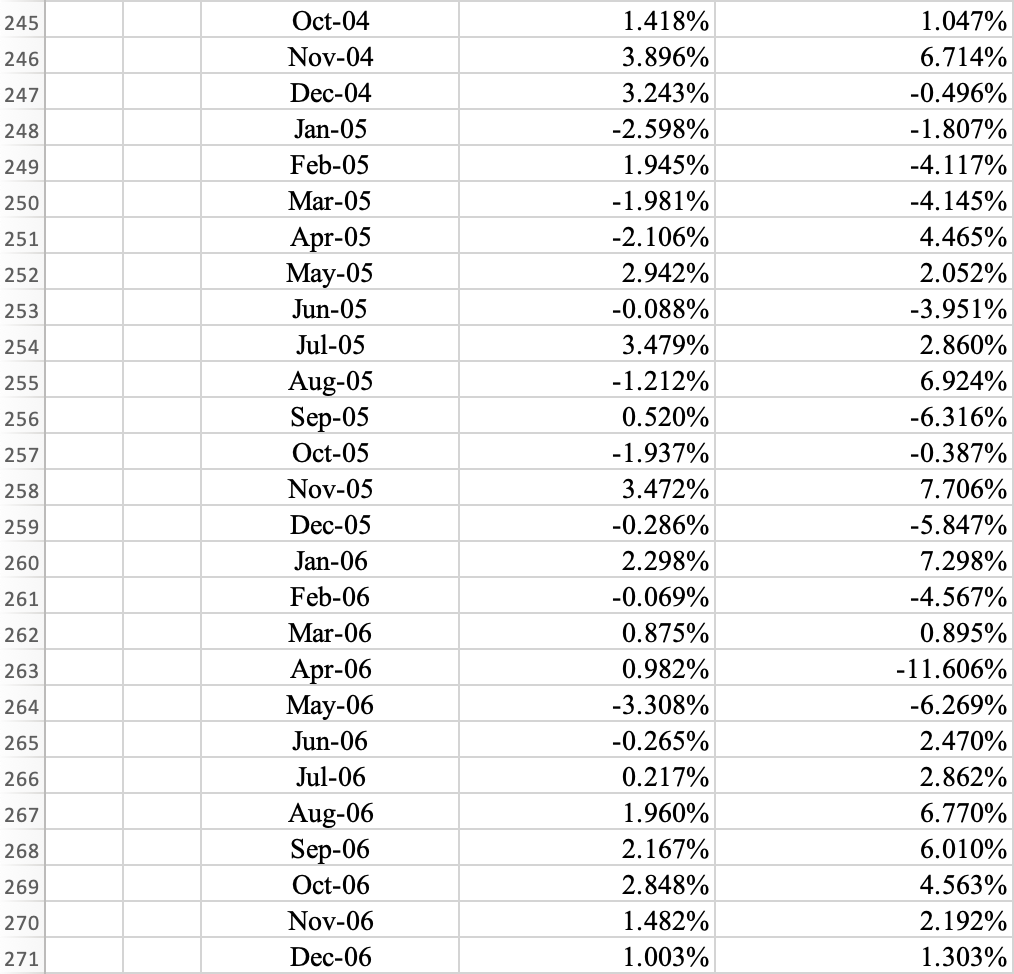
Problem 12-27 The spreadsheet below has data on Microsoft and the S&P 500 from 1986 to 2006 Complete the steps below using cell references to given data or previous calculations. In some cases, a simple cell reference is all you need. To copylpaste a formula across a row or down a column, an absolute cell reference or a mixed cell reference may be preferred. Ifa specific Excel function is to be used, the directions will specify the use of that function. Do not type in numerical data into a cell orfunction. Instead, make a reference to the cell in which the data is found. Make your computations only in the blue cells highlighted below. In all cases, unless otherwise directed, use the earliest appearance of the data in your formulas, usually the Given Data section. a. Estimate Microsoft's beta using linear regression over the periods 1987-1991, 1992-1996, 1997-2001, and 2002-2006 b. Compare the four estimated betas. What do you conclude about how Microsoft's exposure to systematic risk changed over that 20-year period? What do you think explains the change? a. Estimate Microsoft's beta using linear regression over the periods 1987-1991, 1992-1996, 1997-2001, and 2002-2006 Beta 1987-1991 Beta 1992-1996 Beta 1997-2001 Beta 2002-2006 b. Compare the four estimated betas. What do you conclude about how Microsoft's exposure to systematic risk changed over that 20-year period? What do you think explains the change? Systematic Risk Systematic Risk Systematic Risk in the early 1990's as Microsoft established itself as a dominant company. during the internet bubble in the late 1990's (when tech stocks soared). since the early 2000's. Month Jan-87 Feb-87 Mar-87 Apr-87 May-87 Jun-87 Jul-87 Aug-87 Sep-87 Oct-87 Nov-87 Dec-87 Jan-88 Feb-88 Mar-88 Apr-88 May-88 Jun-88 Jul-88 Aug-88 Sep-88 Oct-88 Nov-88 Dec-88 Jan-89 Feb-89 S&P 500 Microsoft 13.045% 3.522% 2.415% -1.328% 0.487% 4.570% 4.606% 3.261% -2.642% -22.136% -8.591% 7.217% 3.916% 4.201% -3.529% 0.646% 0.355% 4.081% -0.892% -3.995% 3.633% 2.213% -1.995% 1.114% 6.760% -3090% 51.134% 4.527% 25.589% 7.054% 10.437% -1 1 .977% -8.303% 25.860% 1 1 . 129% -25.506% -10.400% 20.839% 2.475% 6.042% -5.282% -4.000% 5.912% 15.027% -11 . 704% -16.556% 3.880% -6.830% 4.141% 12.068% 11 .422% -0.820% 32 34 36 37 38 39 40 42 43 45 46 47 48 49 50 51 52 54 56 57 May-91 Jun-91 Jul-91 Aug-91 Sep-91 Oct-91 Nov-91 Dec-91 Jan-92 Feb-92 Mar-92 Apr-92 May-92 Jun-92 Jul-92 Aug-92 Sep-92 Oct-92 Nov-92 Dec-92 Jan-93 Feb-93 Mar-93 Apr-93 May-93 Jun-93 3. 844% -5.001% 4.171% 1 . 907% -2.131% 0.925% -4.419% 1 1 .057% -2.204% 1.015% -2.285% 2.615% 0.210% -1 . 807% 3.775% -2.307% 0.915% 0116% 3. 175% 0.947% 0.606% 1 . 143% 1 . 860% -2.657% 2.455% 0.043% 10.389% -7.311% 7.400% 15.526% 3.939% 5.058% 3.205% 14.016% 7.750% 2.423% 4.389% -7.282% 9.471% -13.543% 3.619% 2. 145% 7.794% 10.018% 4.700% -8.602% 1 .088% -3.833% 10.695% -7.808% 8. 1 13% -5.243% 85 87 89 90 92 94 96 97 98 100 101 102 103 104 105 106 107 108 109 Jul-93 -0.642% 3.544% -1.027% 1 . 848% -1.203% 0.979% 3.150% -2.924% 4.630% 1.012% 1.321% -2.761% 3. 004% 3.730% -2.815% 1 . 867% -4.013% 1 . 044 % 2.173% 3.497% 2.491% 2.505% 3.457% 1.853% 2.866% -0.219% 3.790% -16. 149% 1.270% 9.557% -3.099% -0.406% 0.551% 5.331% -3.294% 2.457% 8.875% 15.896% 4.263% -0.522% 12.49490 -3.811% 11 . 869% -0.568% -3.223% -3.283% 5.705% 12.437% 14.498% 3.053% 6.246% -0.312% 1.740% -2.592% 110 Sep-93 Oct-93 Nov-93 Dec-93 Jan-94 Feb-94 Mar-94 Apr-94 May-94 112 113 114 115 116 118 119 120 121 122 123 124 125 126 127 128 129 130 131 132 133 134 135 136 Jul-94 Sep-94 Oct-94 Nov-94 Dec-94 Jan-95 Feb-95 Mar-95 Apr-95 May-95 2 Jul-95 Sep-95 -0.827% 3.970% 1 .436% 2.974% 0.537% 0.573% 1.014% 2.159% -0.019% 4.868% 1 . 699% 5.188% 2.338% 7. 149% -2.441% 5.797% 0.394% 4.539% 5.540% 5.598% 4. I 10% 7.527% -6.012% 5.037% -3.760% 4.239% 1.237% 10.027% -13.295% 0.227% 4.983% 6.299% 4. I 07% 9.358% 4.437% 0.758% -2.323% 3.514% 7.213% 3.656% 13.889% 4.879% 22.999% 4. 802% -6.392% 32.085% 1.568% 1.545% 11.538% -6.991% -0.345% -2. 168% 8.456% -9.137% Oct-95 Nov-95 Dec-95 Jan-96 Feb-96 Mar-96 Apr-96 137 138 139 140 141 142 143 144 145 146 147 148 149 150 151 152 153 154 155 156 157 158 159 160 161 162 Jun-96 Jul-96 2 Sep-96 Oct-96 Nov-96 Dec-96 Jan-97 Feb-97 Mar-97 Apr-97 Jun-97 Jul-97 1 ep Oct-97 Nov-97 Dec-97 163 0.676% 6.823% 4.731% 0.576% -2 1 1 9% 3.652% -1.465% -14.888% 5.946% 7.814% 5.751% 5.383% 3.832% -3.458% 3.571% 3.503% -2.701% 5. 150% -3.502% -0.885% -3.131% 5.938% 1.673% 5.450% -5.434% -2.323% 9.313% 14.996% 13.225% 5.215% 0.268% -6.295% 27.372% 1.042% -13.165% 14.263% 4. 125% 14.920% 13.298% 25.833% -14.564% 18.970% -9.645% -1.109% 11 . 374% -5.231% 7.476% -2.551% 1.818% -1 .997% 27.791% -16.577% -9. 1 15% 18.411% 164 165 166 167 168 169 170 Jan-98 Feb-98 Mar-98 Apr-98 98 Jun-98 Jul-98 Sep-98 Oct-98 172 173 174 175 176 Dec-98 Jan-99 Feb-99 Mar-99 Apr-99 May-99 Jun-99 Jul-99 178 179 180 182 183 Sep-99 Oct-99 185 186 187 188 189 190 Dec-99 Jan-00 Feb-00 Mar-00 35240877, 1 8 8 9 6 1 2 9 9 7 1 1 7497835 107, 1 0 1 3 0 0 3 6 4 9 9 4 2 1 8 2 5 2 754921 8842 1 6 2 9 2 7 7 4 7 2 6 1 5420952473 407304374037315940303383327 3121-11-24 | -2 925319341885104405716993574 656418891007851875802953175 450077930057337253657506282 322255080396702168170123607 ptvc 1 3 4 5 6 7 8 9 0 1 2 3 4 5 6 7 8 9 0 1 2 3 4 5 6 7 999999999000000000011111111 111111111222222222222222222 1.047% 6.714% -0.496% -1 . 807% -411 7% 4. 145% 4.465% 2.052% -3.951% 2.860% 6.924% -6.316% -0.387% 7706% -5.847% 7.298% 4.567% 0.895% -11 . 606% -6.269% 2.470% 2.862% 6.770% 6.010% 4.563% 2. 192% 1.303% Oct-04 Nov-04 Dec-04 Jan-05 Feb-05 Mar-05 Apr-05 245 246 247 248 249 250 251 252 253 254 255 256 257 258 259 260 261 262 263 264 265 266 267 268 269 270 271 1.418% 3.896% 3.243% -2.598% 1.945% -1.981% -2. 106% 2.942% -0.088% 3.479% -1.212% 0.520% -1.937% 3.472% -0.286% 2.298% -0.069% 0.875% 0.982% -3.308% -0.265% 0.217% 1 . 960% 2. I 67% 2.848% 1 .482% 1.003% Jun-05 Jul-05 ep Oct-05 Nov-05 Dec-05 Jan-06 Feb-06 Mar-06 Apr-06 ay-06 Jun-06 Jul-06 Sep-06 Oct-06 Nov-06 Dec-06 Problem 12-27 The spreadsheet below has data on Microsoft and the S&P 500 from 1986 to 2006 Complete the steps below using cell references to given data or previous calculations. In some cases, a simple cell reference is all you need. To copylpaste a formula across a row or down a column, an absolute cell reference or a mixed cell reference may be preferred. Ifa specific Excel function is to be used, the directions will specify the use of that function. Do not type in numerical data into a cell orfunction. Instead, make a reference to the cell in which the data is found. Make your computations only in the blue cells highlighted below. In all cases, unless otherwise directed, use the earliest appearance of the data in your formulas, usually the Given Data section. a. Estimate Microsoft's beta using linear regression over the periods 1987-1991, 1992-1996, 1997-2001, and 2002-2006 b. Compare the four estimated betas. What do you conclude about how Microsoft's exposure to systematic risk changed over that 20-year period? What do you think explains the change? a. Estimate Microsoft's beta using linear regression over the periods 1987-1991, 1992-1996, 1997-2001, and 2002-2006 Beta 1987-1991 Beta 1992-1996 Beta 1997-2001 Beta 2002-2006 b. Compare the four estimated betas. What do you conclude about how Microsoft's exposure to systematic risk changed over that 20-year period? What do you think explains the change? Systematic Risk Systematic Risk Systematic Risk in the early 1990's as Microsoft established itself as a dominant company. during the internet bubble in the late 1990's (when tech stocks soared). since the early 2000's. Month Jan-87 Feb-87 Mar-87 Apr-87 May-87 Jun-87 Jul-87 Aug-87 Sep-87 Oct-87 Nov-87 Dec-87 Jan-88 Feb-88 Mar-88 Apr-88 May-88 Jun-88 Jul-88 Aug-88 Sep-88 Oct-88 Nov-88 Dec-88 Jan-89 Feb-89 S&P 500 Microsoft 13.045% 3.522% 2.415% -1.328% 0.487% 4.570% 4.606% 3.261% -2.642% -22.136% -8.591% 7.217% 3.916% 4.201% -3.529% 0.646% 0.355% 4.081% -0.892% -3.995% 3.633% 2.213% -1.995% 1.114% 6.760% -3090% 51.134% 4.527% 25.589% 7.054% 10.437% -1 1 .977% -8.303% 25.860% 1 1 . 129% -25.506% -10.400% 20.839% 2.475% 6.042% -5.282% -4.000% 5.912% 15.027% -11 . 704% -16.556% 3.880% -6.830% 4.141% 12.068% 11 .422% -0.820% 32 34 36 37 38 39 40 42 43 45 46 47 48 49 50 51 52 54 56 57 May-91 Jun-91 Jul-91 Aug-91 Sep-91 Oct-91 Nov-91 Dec-91 Jan-92 Feb-92 Mar-92 Apr-92 May-92 Jun-92 Jul-92 Aug-92 Sep-92 Oct-92 Nov-92 Dec-92 Jan-93 Feb-93 Mar-93 Apr-93 May-93 Jun-93 3. 844% -5.001% 4.171% 1 . 907% -2.131% 0.925% -4.419% 1 1 .057% -2.204% 1.015% -2.285% 2.615% 0.210% -1 . 807% 3.775% -2.307% 0.915% 0116% 3. 175% 0.947% 0.606% 1 . 143% 1 . 860% -2.657% 2.455% 0.043% 10.389% -7.311% 7.400% 15.526% 3.939% 5.058% 3.205% 14.016% 7.750% 2.423% 4.389% -7.282% 9.471% -13.543% 3.619% 2. 145% 7.794% 10.018% 4.700% -8.602% 1 .088% -3.833% 10.695% -7.808% 8. 1 13% -5.243% 85 87 89 90 92 94 96 97 98 100 101 102 103 104 105 106 107 108 109 Jul-93 -0.642% 3.544% -1.027% 1 . 848% -1.203% 0.979% 3.150% -2.924% 4.630% 1.012% 1.321% -2.761% 3. 004% 3.730% -2.815% 1 . 867% -4.013% 1 . 044 % 2.173% 3.497% 2.491% 2.505% 3.457% 1.853% 2.866% -0.219% 3.790% -16. 149% 1.270% 9.557% -3.099% -0.406% 0.551% 5.331% -3.294% 2.457% 8.875% 15.896% 4.263% -0.522% 12.49490 -3.811% 11 . 869% -0.568% -3.223% -3.283% 5.705% 12.437% 14.498% 3.053% 6.246% -0.312% 1.740% -2.592% 110 Sep-93 Oct-93 Nov-93 Dec-93 Jan-94 Feb-94 Mar-94 Apr-94 May-94 112 113 114 115 116 118 119 120 121 122 123 124 125 126 127 128 129 130 131 132 133 134 135 136 Jul-94 Sep-94 Oct-94 Nov-94 Dec-94 Jan-95 Feb-95 Mar-95 Apr-95 May-95 2 Jul-95 Sep-95 -0.827% 3.970% 1 .436% 2.974% 0.537% 0.573% 1.014% 2.159% -0.019% 4.868% 1 . 699% 5.188% 2.338% 7. 149% -2.441% 5.797% 0.394% 4.539% 5.540% 5.598% 4. I 10% 7.527% -6.012% 5.037% -3.760% 4.239% 1.237% 10.027% -13.295% 0.227% 4.983% 6.299% 4. I 07% 9.358% 4.437% 0.758% -2.323% 3.514% 7.213% 3.656% 13.889% 4.879% 22.999% 4. 802% -6.392% 32.085% 1.568% 1.545% 11.538% -6.991% -0.345% -2. 168% 8.456% -9.137% Oct-95 Nov-95 Dec-95 Jan-96 Feb-96 Mar-96 Apr-96 137 138 139 140 141 142 143 144 145 146 147 148 149 150 151 152 153 154 155 156 157 158 159 160 161 162 Jun-96 Jul-96 2 Sep-96 Oct-96 Nov-96 Dec-96 Jan-97 Feb-97 Mar-97 Apr-97 Jun-97 Jul-97 1 ep Oct-97 Nov-97 Dec-97 163 0.676% 6.823% 4.731% 0.576% -2 1 1 9% 3.652% -1.465% -14.888% 5.946% 7.814% 5.751% 5.383% 3.832% -3.458% 3.571% 3.503% -2.701% 5. 150% -3.502% -0.885% -3.131% 5.938% 1.673% 5.450% -5.434% -2.323% 9.313% 14.996% 13.225% 5.215% 0.268% -6.295% 27.372% 1.042% -13.165% 14.263% 4. 125% 14.920% 13.298% 25.833% -14.564% 18.970% -9.645% -1.109% 11 . 374% -5.231% 7.476% -2.551% 1.818% -1 .997% 27.791% -16.577% -9. 1 15% 18.411% 164 165 166 167 168 169 170 Jan-98 Feb-98 Mar-98 Apr-98 98 Jun-98 Jul-98 Sep-98 Oct-98 172 173 174 175 176 Dec-98 Jan-99 Feb-99 Mar-99 Apr-99 May-99 Jun-99 Jul-99 178 179 180 182 183 Sep-99 Oct-99 185 186 187 188 189 190 Dec-99 Jan-00 Feb-00 Mar-00 35240877, 1 8 8 9 6 1 2 9 9 7 1 1 7497835 107, 1 0 1 3 0 0 3 6 4 9 9 4 2 1 8 2 5 2 754921 8842 1 6 2 9 2 7 7 4 7 2 6 1 5420952473 407304374037315940303383327 3121-11-24 | -2 925319341885104405716993574 656418891007851875802953175 450077930057337253657506282 322255080396702168170123607 ptvc 1 3 4 5 6 7 8 9 0 1 2 3 4 5 6 7 8 9 0 1 2 3 4 5 6 7 999999999000000000011111111 111111111222222222222222222 1.047% 6.714% -0.496% -1 . 807% -411 7% 4. 145% 4.465% 2.052% -3.951% 2.860% 6.924% -6.316% -0.387% 7706% -5.847% 7.298% 4.567% 0.895% -11 . 606% -6.269% 2.470% 2.862% 6.770% 6.010% 4.563% 2. 192% 1.303% Oct-04 Nov-04 Dec-04 Jan-05 Feb-05 Mar-05 Apr-05 245 246 247 248 249 250 251 252 253 254 255 256 257 258 259 260 261 262 263 264 265 266 267 268 269 270 271 1.418% 3.896% 3.243% -2.598% 1.945% -1.981% -2. 106% 2.942% -0.088% 3.479% -1.212% 0.520% -1.937% 3.472% -0.286% 2.298% -0.069% 0.875% 0.982% -3.308% -0.265% 0.217% 1 . 960% 2. I 67% 2.848% 1 .482% 1.003% Jun-05 Jul-05 ep Oct-05 Nov-05 Dec-05 Jan-06 Feb-06 Mar-06 Apr-06 ay-06 Jun-06 Jul-06 Sep-06 Oct-06 Nov-06 Dec-06


