Problem 13-1A Calculation and analysis of trend percents LO A1, P1 Selected comparative financial statements of Haroun Company follow.
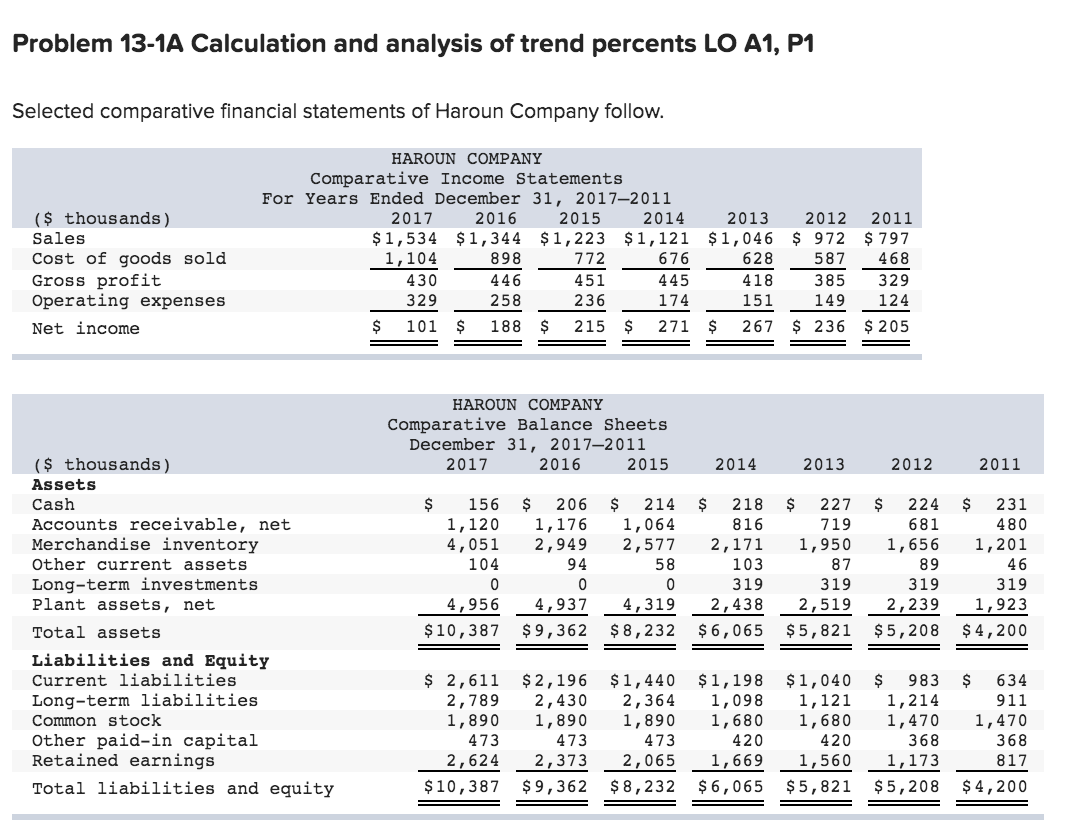
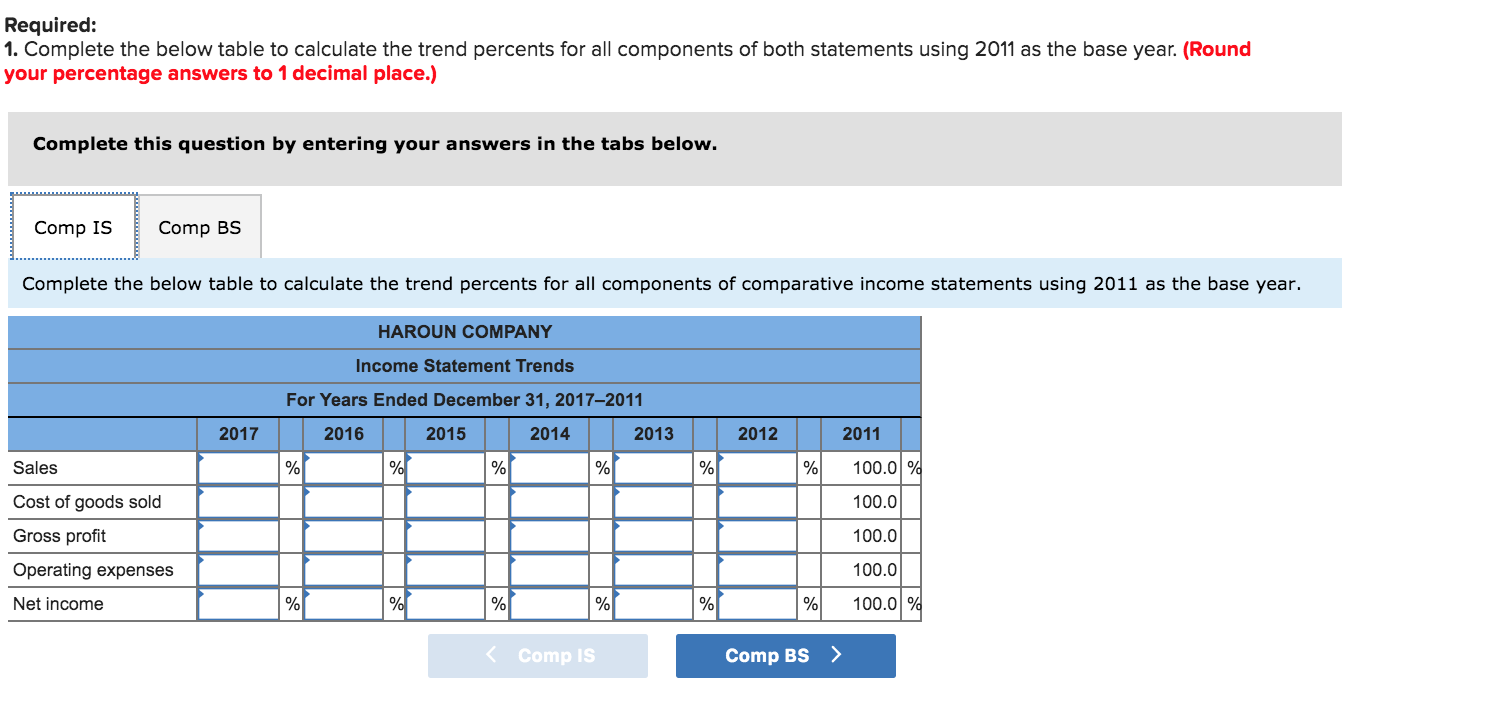
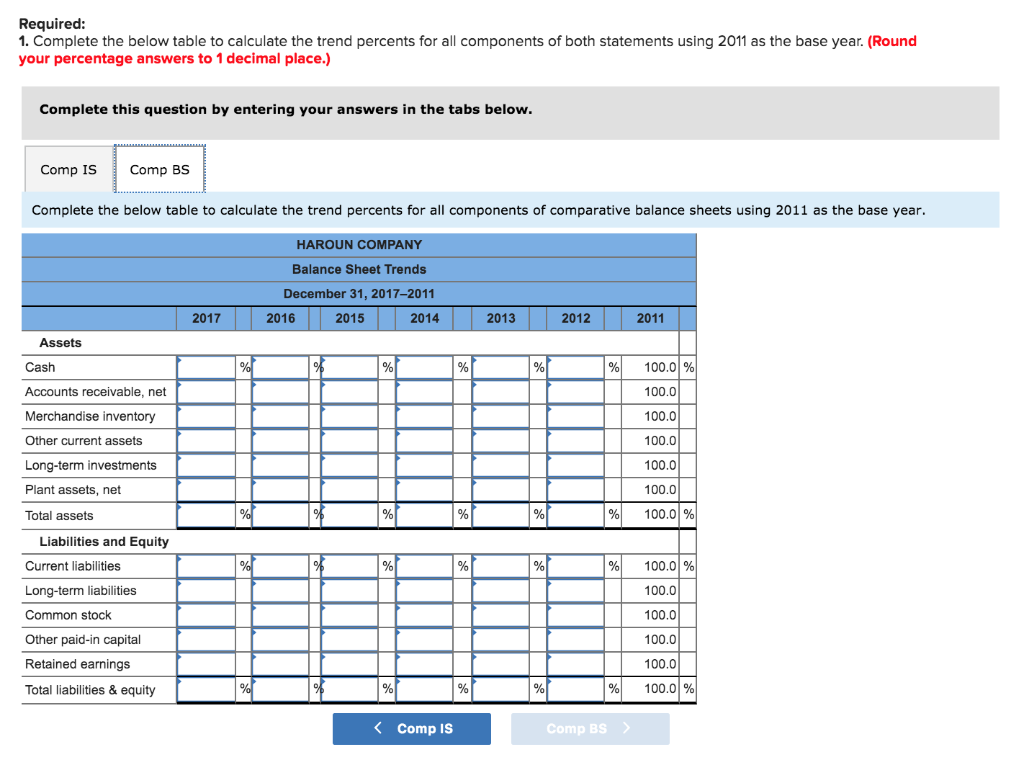
Problem 13-1A Calculation and analysis of trend percents LO A1, P1 Selected comparative financial statements of Haroun Company follow. ($ thousands) Sales Cost of goods sold Gross profit Operating expenses Net income HAROUN COMPANY Comparative Income Statements For Years Ended December 31, 20172011 2017 2016 2015 2014 2013 2012 2011 $1,534 $1,344 $1,223 $1,121 $1,046 $ 972 $ 797 1,104 898 772 676 628 587 468 430 446 451 445418385 329 329 258 236 174 151 149 124 $ 101 $ 188 $ 215 $ 271 $ 267 $ 236 $ 205 HAROUN COMPANY Comparative Balance Sheets December 31, 20172011 2017 2016 2015 2014 2013 2012 2011 $ $ $ 156 1,120 4,051 104 206 1,176 2,949 94 224 681 1,656 ($ thousands) Assets Cash Accounts receivable, net Merchandise inventory Other current assets Long-term investments Plant assets, net Total assets Liabilities and Equity Current liabilities Long-term liabilities Common stock Other paid-in capital Retained earnings Total liabilities and equity $ 214 1,064 2,577 58 0 4,319 $ 8,232 $ 218 8 16 2,171 103 319 2,438 $6,065 $ 227 719 1,950 8 7 319 2,519 $5,821 $ 231 480 1,201 46 319 1,923 $4,200 4,956 $10,387 4,937 $9,362 319 2,239 $5,208 $ 2,611 2,789 1,890 473 2,624 $10,387 $2,196 2,430 1,890 473 2,373 $9,362 $1,440 2,364 1,890 473 2,065 $8,232 $1,198 1,098 1,680 420 1,669 $6,065 $1,040 1,121 1,680 420 1,560 $5,821 $ 983 $ 634 1,214 911 1,470 1,470 368 368 1,173 817 $5,208 $4,200 Required: 1. Complete the below table to calculate the trend percents for all components of both statements using 2011 as the base year. (Round your percentage answers to 1 decimal place.) Complete this question by entering your answers in the tabs below. Comp IS Comp BS Complete the below table to calculate the trend percents for all components of comparative income statements using 2011 as the base year. HAROUN COMPANY Income Statement Trends For Years Ended December 31, 20172011 2016 2015 2014 2013 2017 2012 Sales % Cost of goods sold Gross profit Operating expenses Net income 2011 100.0 % 100.0 100.0 100.0 100.0% C Comp IS Comp BS > Required: 1. Complete the below table to calculate the trend percents for all components of both statements using 2011 as the base year. (Round your percentage answers to 1 decimal place.) Complete this question by entering your answers in the tabs below. Comp IS Comp BS Complete the below table to calculate the trend percents for all components of comparative balance sheets using 2011 as the base year. HAROUN COMPANY Balance Sheet Trends December 31, 2017-2011 2016 2015 2014 2017 2013 2012 2011 % % % % Assets Cash Accounts receivable, net Merchandise inventory Other current assets 100.0 % 100.0 100.0 100.0 Long-term investments Plant assets, net 100.0 100.0 Total assets % % % % % % 100.0 % % % % % Liabilities and Equity Current liabilities Long-term liabilities Common stock Other paid-in capital Retained earnings D Total liabilities & equity % % 100.0 % 100.0 100.0 100.0 D 100.0 % % 100.0 % Comp BS ) D % D % D D % %