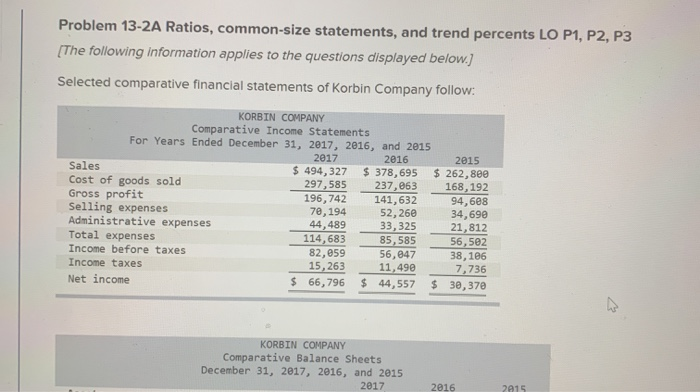
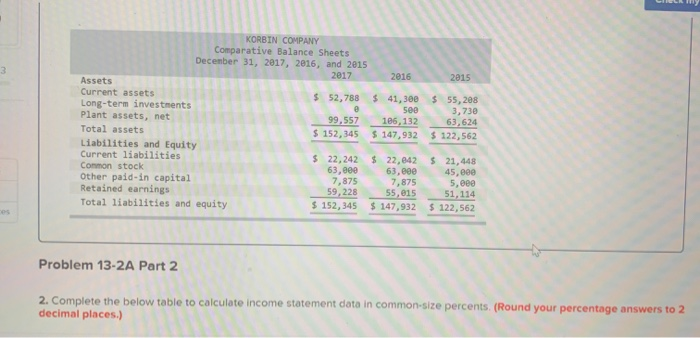
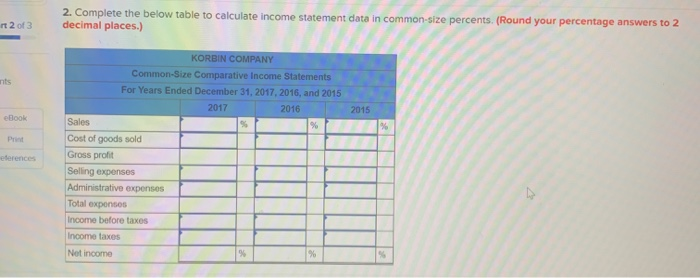
Problem 13-2A Ratios, common-size statements, and trend percents LO P1, P2, P3 [The following information applies to the questions displayed below.) Selected comparative financial statements of Korbin Company follow: KORBIN COMPANY Comparative Income Statements For Years Ended December 31, 2017, 2016, and 2015 2017 2016 2015 Sales $ 494,327 $ 378,695 $ 262,800 Cost of goods sold 297,585 237,863 168,192 Gross profit 196,742 141,632 94,608 Selling expenses 78,194 52,260 34,690 Administrative expenses 44,489 33, 325 21,812 Total expenses 114,683 85,585 56,502 Income before taxes 82,059 56,047 38,106 Income taxes 15,263 11,490 7,736 Net income $ 66,796 $ 44,557 $ 30,370 KORBIN COMPANY Comparative Balance Sheets December 31, 2017, 2016, and 2015 2017 2016 2015 3 KORBIN COMPANY Comparative Balance Sheets December 31, 2017, 2016, and 2015 2017 2016 2015 Assets Current assets $ 52,788 $ 41,300 $ 55,208 Long-term investments e see 3,730 Plant assets, net 99,557 186,132 63,624 Total assets $ 152,345 $ 147,932 $ 122,562 Liabilities and Equity Current liabilities $ 22,242 $ 22,042 $ 21,448 Common stock 63,000 63,eee 45,000 Other paid in capital 7,875 7,875 Retained earnings 59, 228 55,015 51,114 Total liabilities and equity $ 152,345 $ 147,932 $ 122,562 5, eee Problem 13-2A Part 2 2. Complete the below table to calculate income statement data in common-size percents. (Round your percentage answers to 2 decimal places.) 2. Complete the below table to calculate income statement data in common-size percents (Round your percentage answers to 2 decimal places.) rt 2 of 3 nts 2015 eBook % eference KORBIN COMPANY Common-Size Comparative Income Statements For Years Ended December 31, 2017, 2016, and 2015 2017 2016 Sales % Cost of goods sold Gross profit Selling expenses Administrative expenses Total expenses Income before taxes Income taxes % Not income