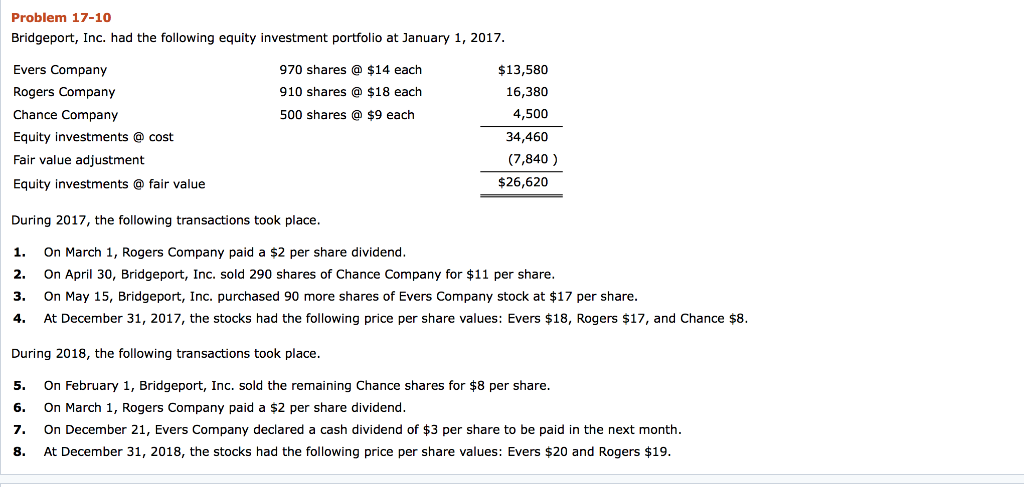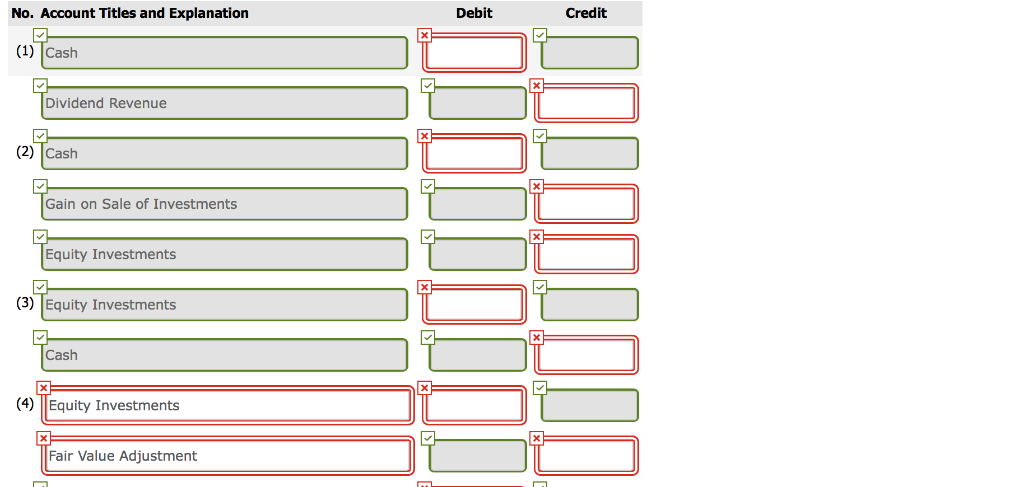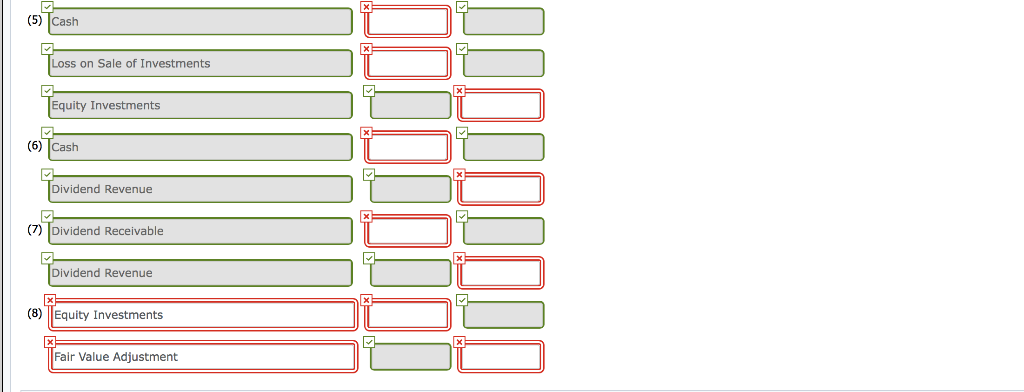


Problem 17-10 Bridgeport, Inc. had the following equity investment portfolio at January 1, 2017 Evers Company Rogers Company Chance Company Equity investments @ cost Fair value adjustment Equity investments fair value 970 shares $14 each 910 shares $18 each 500 shares $9 each $13,580 16,380 4,500 34,460 (7,840) $26,620 During 2017, the following transactions took place 1. On March 1, Rogers Company paid a $2 per share dividend 2. On April 30, Bridgeport, Inc. sold 290 shares of Chance Company for $11 per share 3. On May 15, Bridgeport, Inc. purchased 90 more shares of Evers Company stock at $17 per share 4. At December 31, 2017, the stocks had the following price per share values: Evers $18, Rogers $17, and Chance $8 During 2018, the following transactions took place 5. On February 1, Bridgeport, Inc. sold the remaining Chance shares for $8 per share 6. On March 1, Rogers Company paid a $2 per share dividend 7. On December 21, Evers Company declared a cash dividend of $3 per share to be paid in the next month 8. At December 31, 2018, the stocks had the following price per share values: Evers $20 and Rogers $19 No. Account Titles and Explanation Debit Credit (1) Cash Dividend Revenue (2) Cash Gain on Sale of Investments Equity Investments (3) Equity Investments Cash (4)Equity Investments Fair Value Adjustment (5) Cash Loss on Sale of Investments Equity Investments (6) Cash Dividend Revenue (7)Dividend Receivable Dividend Revenue (8) Equity Investments Fair Value Adjustment Prepare a partial balance sheet showing the investment-related amounts to be reported at December 31, 2017 and 2018 Bridgeport, Inc. Balance Sheet (Partial) December 31, 2017 December 31, 2018 Investments Fair Value Adjustment Investments Fair Value Adjustment Problem 17-10 Bridgeport, Inc. had the following equity investment portfolio at January 1, 2017 Evers Company Rogers Company Chance Company Equity investments @ cost Fair value adjustment Equity investments fair value 970 shares $14 each 910 shares $18 each 500 shares $9 each $13,580 16,380 4,500 34,460 (7,840) $26,620 During 2017, the following transactions took place 1. On March 1, Rogers Company paid a $2 per share dividend 2. On April 30, Bridgeport, Inc. sold 290 shares of Chance Company for $11 per share 3. On May 15, Bridgeport, Inc. purchased 90 more shares of Evers Company stock at $17 per share 4. At December 31, 2017, the stocks had the following price per share values: Evers $18, Rogers $17, and Chance $8 During 2018, the following transactions took place 5. On February 1, Bridgeport, Inc. sold the remaining Chance shares for $8 per share 6. On March 1, Rogers Company paid a $2 per share dividend 7. On December 21, Evers Company declared a cash dividend of $3 per share to be paid in the next month 8. At December 31, 2018, the stocks had the following price per share values: Evers $20 and Rogers $19 No. Account Titles and Explanation Debit Credit (1) Cash Dividend Revenue (2) Cash Gain on Sale of Investments Equity Investments (3) Equity Investments Cash (4)Equity Investments Fair Value Adjustment (5) Cash Loss on Sale of Investments Equity Investments (6) Cash Dividend Revenue (7)Dividend Receivable Dividend Revenue (8) Equity Investments Fair Value Adjustment Prepare a partial balance sheet showing the investment-related amounts to be reported at December 31, 2017 and 2018 Bridgeport, Inc. Balance Sheet (Partial) December 31, 2017 December 31, 2018 Investments Fair Value Adjustment Investments Fair Value Adjustment


