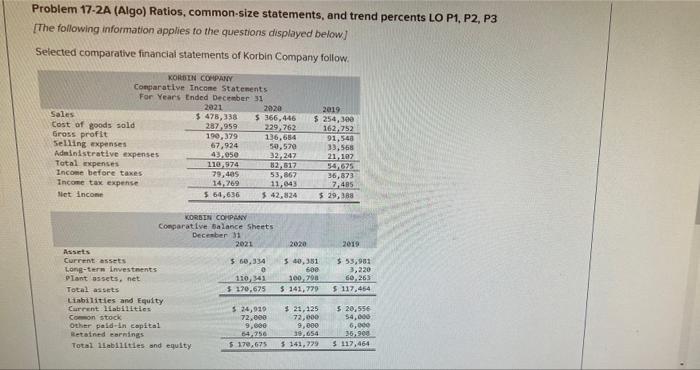
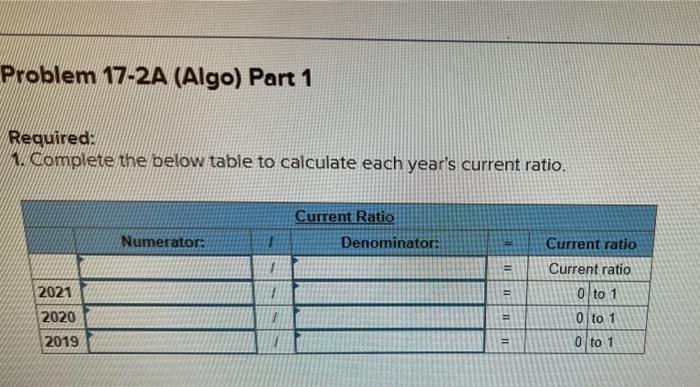
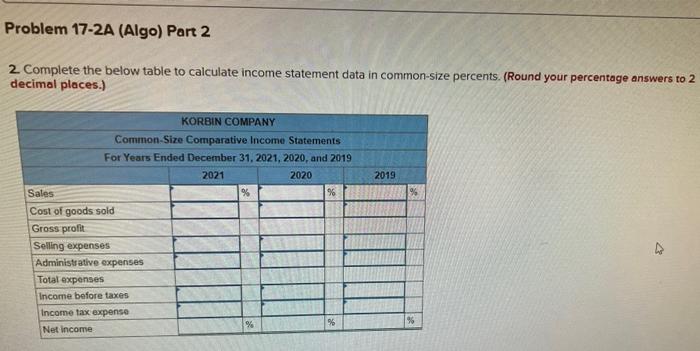
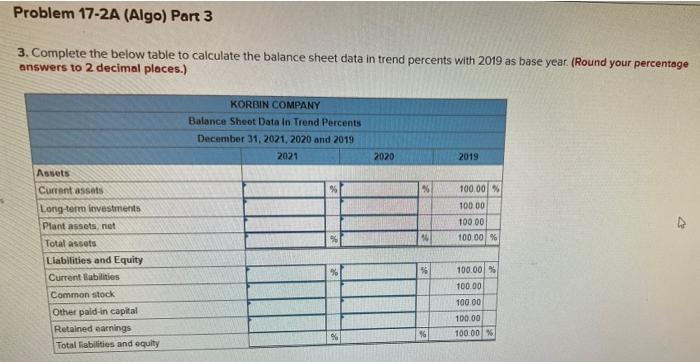
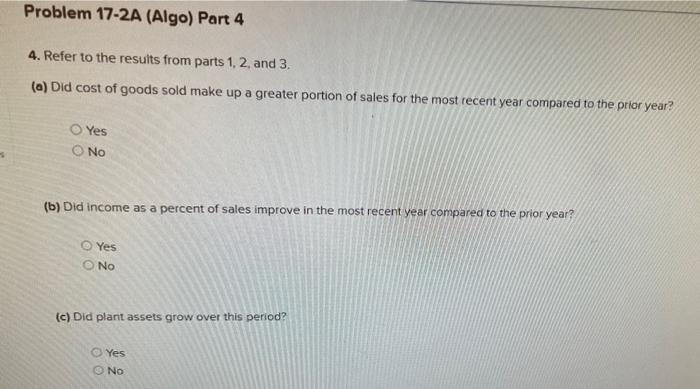
Problem 17-2A (Algo) Ratios, common-size statements, and trend percents LO P1, P2, P3 [The following information applies to the questions displayed below) Selected comparative financial statements of Korbin Company follow KORDIN COMPANY Comparative Income Statements For Years Ended December 31 2021 2020 Sales $ 478,338 5 366,446 Cost of goods sold 287,959 229,762 Gross profit 190,379 136,654 Selling expenses 67,924 50.570 Administrative expenses 43,050 32.247 Total expenses 110,974 82,517 Income before taxes 79,405 53,867 Income tax expense 14,269 11,043 Net Income 5.54,636 42,824 2019 $ 254,300 162,752 91,548 33,568 21. 107 54 625 36,873 7485 $ 29,388 2020 2019 KORSEN COMPANY Comparative Balance Sheets December 31 2021 Assets Current assets 560,334 Long-term investments 0 plant assets, net 110,41 Total assets $170.675 Liabilities and Equity Current liabilities $ 24,919 Comon stock 72,000 Other paid-in capital 9,000 Retained earnings Total abilities and equity $ 170,675 540,381 600 300-200 $ 141,779 $ 53,981 3,220 60.263 $ 117,454 $ 21,125 72,000 9,000 39.654 5141,779 5 20,556 54,000 6,000 35,900 $ 117,464 Problem 17-2A (Algo) Part 1 Required: N. Complete the below table to calculate each year's current ratio. Current Ratio Denominator: Numerator: Current ratio 1 Current ratio 2021 = 0 to 1 0 to 1 2020 11 2019 O to 1 Problem 17-2A (Algo) Part 2 2. Complete the below table to calculate income statement data in common-size percents. (Round your percentage answers to 2 decimal places.) 2019 KORBIN COMPANY Common-Size Comparative Income Statements For Years Ended December 31, 2021, 2020, and 2019 2021 2020 Sales % % Cost of goods sold Gross profit Selling expenses Administrative expenses Total expenses Income before taxes Income tax expense Net income % % 96 Problem 17-2A (Algo) Part 3 3. Complete the below table to calculate the balance sheet data in trend percents with 2019 as base year. (Round your percentage answers to 2 decimal places.) KORBIN COMPANY Balance Sheet Data in Trend Percents December 31, 2021, 2020 and 2019 2021 2020 2019 Assets % Current assets Long-term investments Plant assets, net Total assets Liabilities and Equity Current Babilities 100.00% 100.00 10000 100.00 % 56 Common stock Other pald-in capital Retained earnings Total liabilities and equity 100.00 100.00 10000 100.00 100 00 $ Problem 17-2A (Algo) Part 4 4. Refer to the results from parts 1, 2, and 3. (a) Did cost of goods sold make up a greater portion of sales for the most recent year compared to the prior year? Yes (b) Did income as a percent of sales improve in the most recent year compared to the prior year? Yes No (c) Did plant assets grow over this period? Yes ONo
