

Answered step by step
Verified Expert Solution
Question
1 Approved Answer
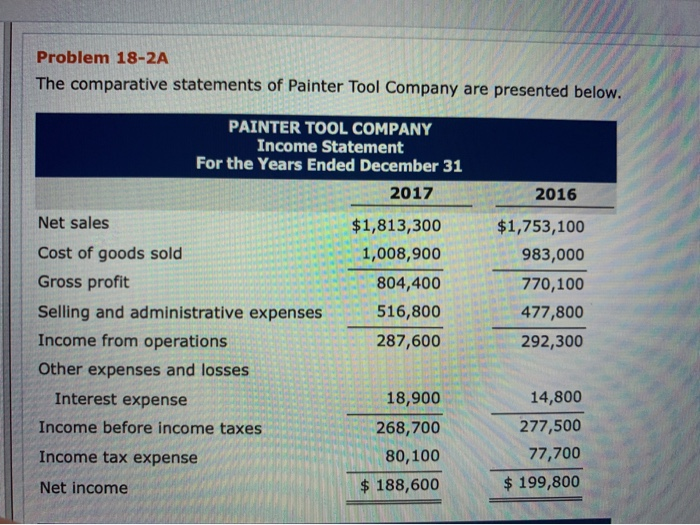
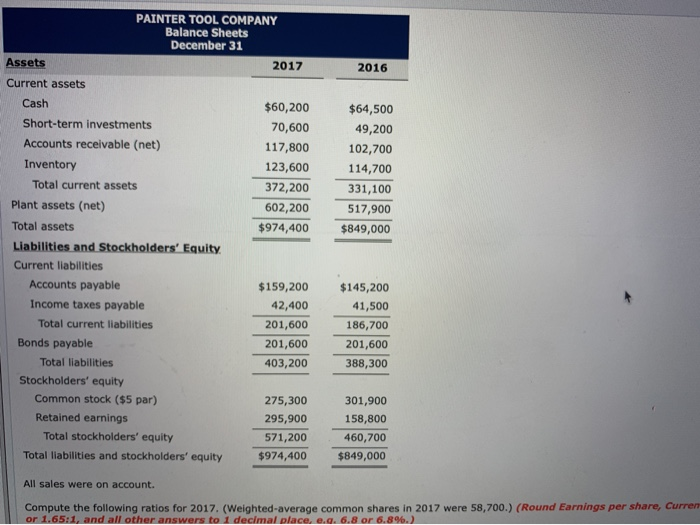
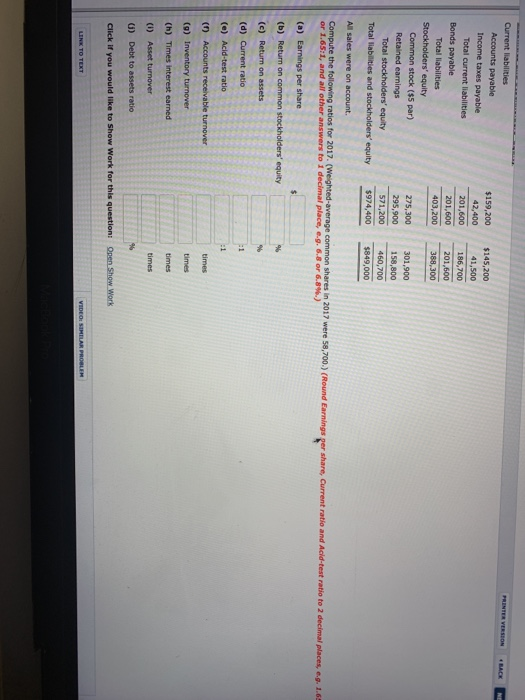
Problem 18-2A The comparative statements of Painter Tool Company are presented below. PAINTER TOOL COMPANY Income Statement For the Years Ended December 31 2017 $1,813,300
Step by Step Solution
There are 3 Steps involved in it
Step: 1

Get Instant Access to Expert-Tailored Solutions
See step-by-step solutions with expert insights and AI powered tools for academic success
Step: 2

Step: 3
Ace Your Homework with AI
Get the answers you need in no time with our AI-driven, step-by-step assistance
Get Started
Introduction To Managerial Accounting Hc 2002 Text Only
Authors: Folk
1st Edition
0071123350, 978-0071123358