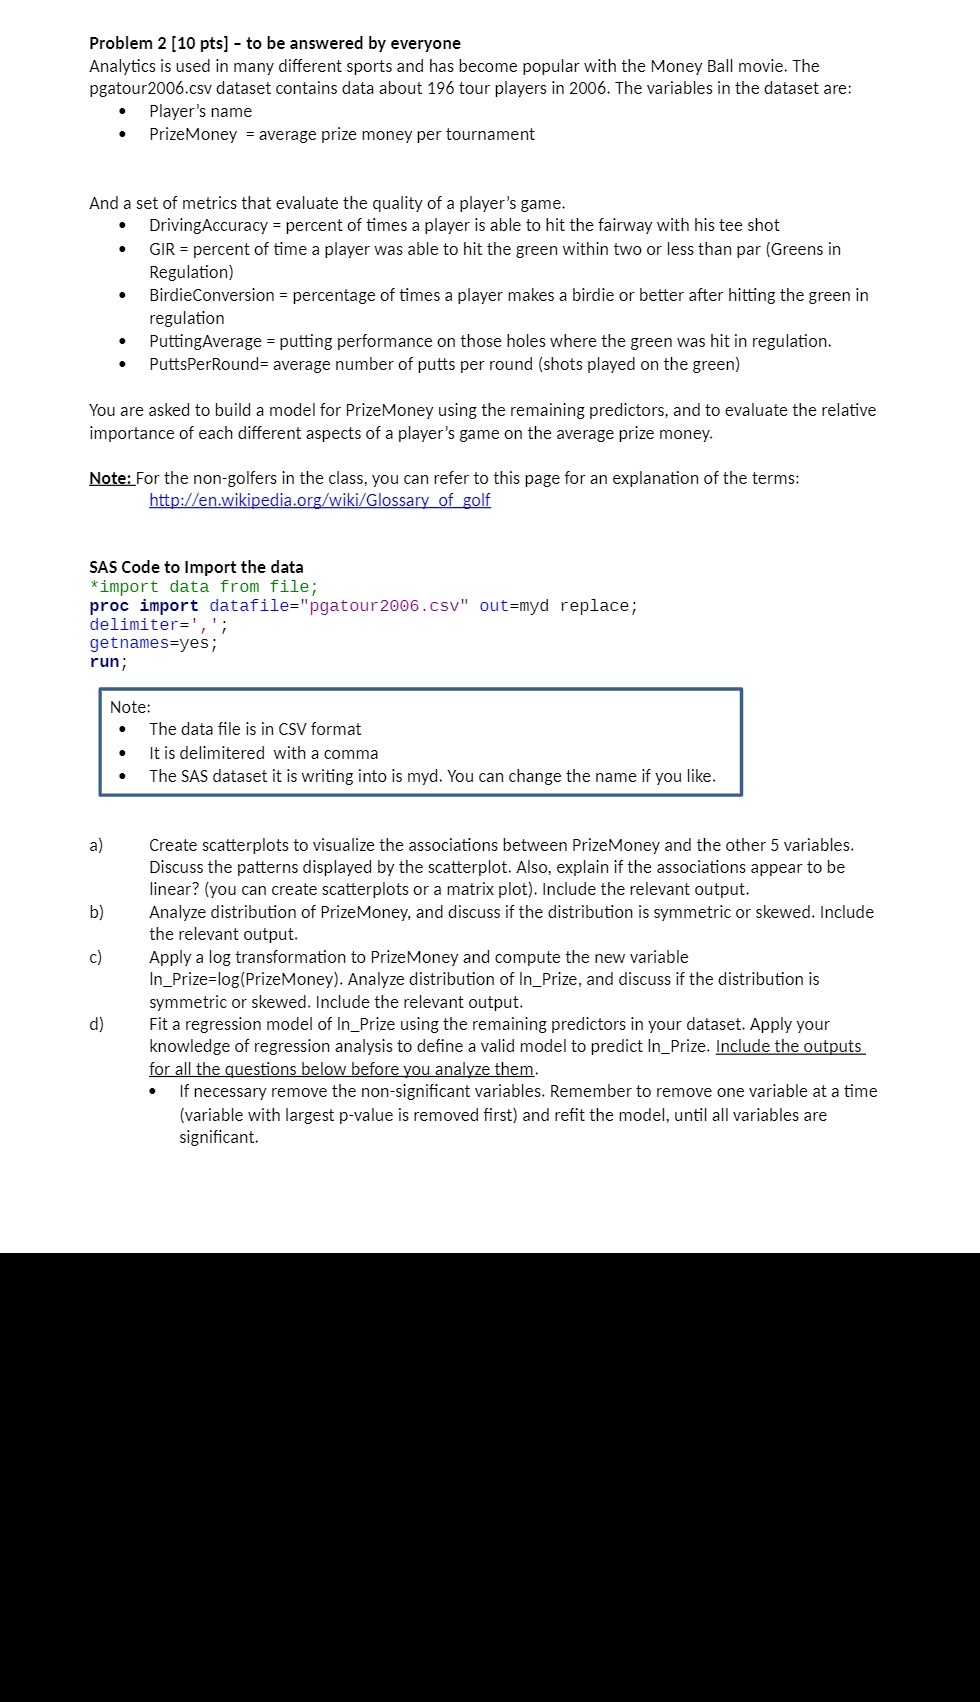
Problem 2 [10 pts] to be answered by everyone Analytics is used in many different sports and has become popular with the Money Ball movie. The pgatour2006.csv dataset contains data about 196 tour players in 2006. The variables in the dataset are: 0 Player's name 0 PrizeMoney = average prize money per tournament And a set of metrics that evaluate the quality of a player's game. 0 DrivingAccuracy = percent of times a player is able to hit the fairway with his tee shot 0 GIR = percent of time a player was able to hit the green within two or less than par [Greens in Regulation) 0 BirdieConversion = percentage of times a player makes a birdie or better after hitting the green in regulation 0 PuttingAverage = putting performance on those holes where the green was hit in regulation. - PuttsPerRound= average number of putts per round {shots played on the green) You are asked to build a model for PrizeMoney using the remaining predictors, and to evaluate the relative importance of each different aspects of a player's game on the average prize money, gte; For the non-golfers in the class, you can refer to this page foran explanation of the terms: http://en.wikipedia.org/wiki/Glossary of golf SAS Code to Import the data *import data from file; proc import datafile="pgatour2006.csv" out=myd replace; delimiter=' , '; getnames=yes; run; Note: 0 The data file is in CSV format 0 It is delimitered with a comma The SAS dataset it is writing into is myd. You can change the name if you like. a) Create scatterplots to visualize the associations between PrizeMoney and the other 5 variables Discuss the patterns displayed by the scatterplot. Also, explain if the associations appear to be linear? {you can create scatterplots or a matrix plot). Include the relevant output. bl Analyze distribution of PrizeMoney, and discuss if the distribution is symmetric or skewed. Include the relevant output cl Apply a log transformation to PrizeMoney and compute the new variable ln_Prize=log(PrizeMoney}, Analyze distribution of ln_Prize, and discuss if the distribution is symmetric or skewed. Include the relevant output, dl Fit a regression model of ln_Prize using the remaining predictors in your dataset, Apply your knowledge of regression analysis to dene a valid model to predict |n_Prize. Include the outputs for all the questions below before you analyze them. 0 if necessary remove the nonsignicant variables. Remember to remove one variable at a time [variable with largest pvalue is removed rst) and refit the model, until all variables are significant


