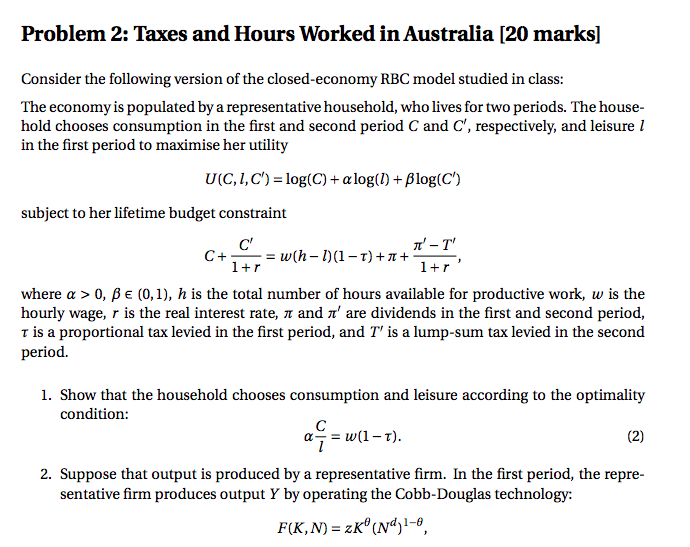
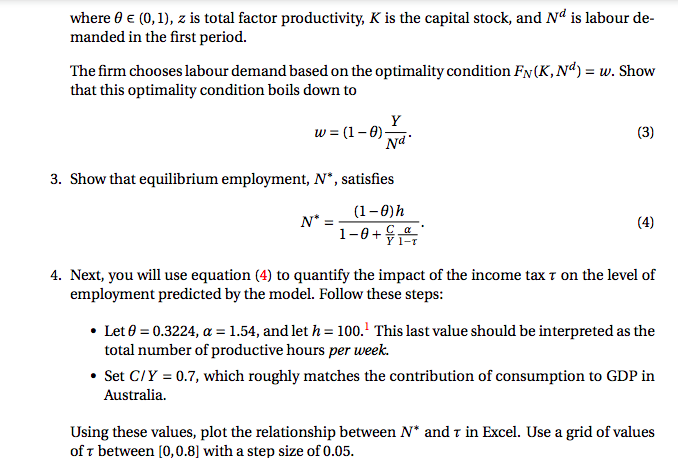
Problem 2: Taxes and Hours Worked in Australia [20 marks] Consider the following version of the closed-economy RBC model studied in class: The economy is populated by a representative household, who lives for two periods. The house- hold chooses consumption in the first and second period C and C', respectively, and leisure / in the first period to maximise her utility U(C, 1, C') = log(C) + alog(1) + Blog(C') subject to her lifetime budget constraint C+ C' -= w(h - D)(1-T) + n+ T' - T' 1+r 1+r where a > 0, Be (0, 1), h is the total number of hours available for productive work, w is the hourly wage, r is the real interest rate, a and a' are dividends in the first and second period, T is a proportional tax levied in the first period, and T' is a lump-sum tax levied in the second period. 1. Show that the household chooses consumption and leisure according to the optimality condition: a = w(1 -T). (2) 2. Suppose that output is produced by a representative firm. In the first period, the repre- sentative firm produces output Y by operating the Cobb-Douglas technology: F(K, N) = zK* (Nd) 1-0where o c (0, 1), z is total factor productivity, K is the capital stock, and N is labour de- manded in the first period. The firm chooses labour demand based on the optimality condition FN (K, NO) = w. Show that this optimality condition boils down to w = (1-0)- Y (3) 3. Show that equilibrium employment, N*, satisfies N* =- (1 -0)h (4) 4. Next, you will use equation (4) to quantify the impact of the income tax r on the level of employment predicted by the model. Follow these steps: . Let 0 = 0.3224, a = 1.54, and let h = 100. This last value should be interpreted as the total number of productive hours per week. . Set C/Y = 0.7, which roughly matches the contribution of consumption to GDP in Australia. Using these values, plot the relationship between N* and t in Excel. Use a grid of values of t between [0,0.8] with a step size of 0.05