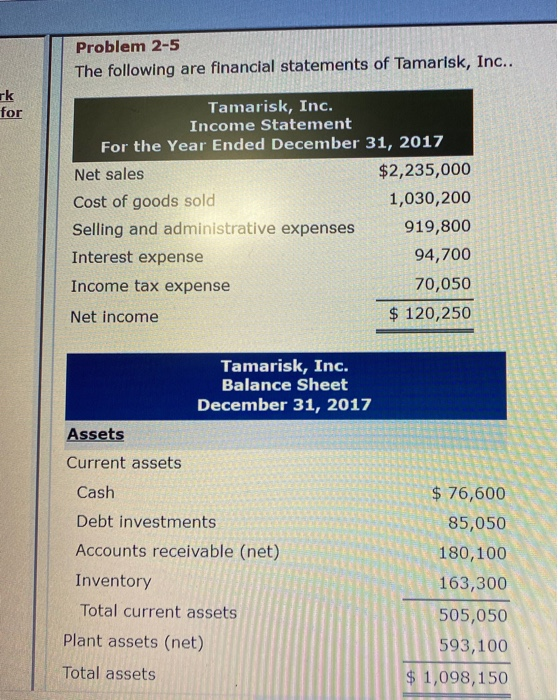
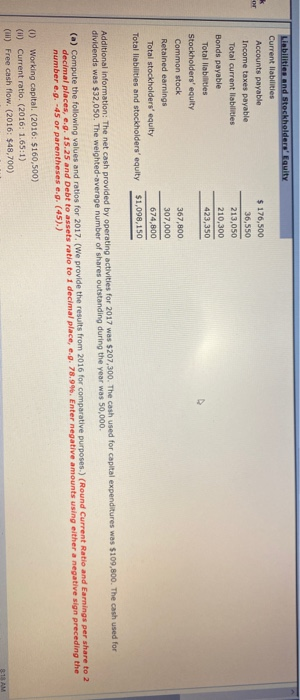
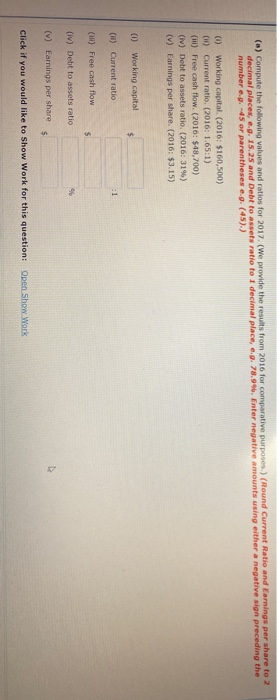
Problem 2-5 The following are financial statements of Tamarisk, Inc.. rk for Tamarisk, Inc. Income Statement For the Year Ended December 31, 2017 Net sales $2,235,000 Cost of goods sold 1,030,200 Selling and administrative expenses 919,800 Interest expense 94,700 Income tax expense 70,050 Net income $ 120,250 Tamarisk, Inc. Balance Sheet December 31, 2017 Assets Current assets Cash Debt investments Accounts receivable (net) Inventory Total current assets Plant assets (net) $ 76,600 85,050 180,100 163,300 505,050 593,100 $ 1,098,150 Total assets Libilities and stockholders' Equity Current liabilities Accounts payable Income taxes payable Total current liabilities Bonds payable Total liabilities Stockholders' equity Common stock Retained earnings Total stockholders' equity Total liabilities and stockholders' equity $ 176,500 36,550 213,050 210,300 423,350 367,800 307.000 674,800 $1,098,150 Additional information: The net cash provided by operating activities for 2017 was $207,300. The cash used for capital expenditures was $109,800. The cash used for dividends was $32,050. The weighted-average number of shares outstanding during the year was 50,000 (a) Compute the following values and ratios for 2017. (We provide the results from 2016 for comparative purposes.) (Round Current Ratio and Earnings per share to 2 decimal places, .. 15.25 and Debt to assets ratio to 1 decimal place, e.g. 78.9%. Enter negative amounts using either a negative sign preceding the number e.g. -45 or parentheses e.g. (45).) (1) Working capital. (2016: $160,500) (W) Current ratio. (2016: 1.65:1) (ill) Free cash flow. (2016: $48,700) 8:13 AM (a) Compute the following values and ratios for 2017. (We provide the results from 2016 for comparative purposes.) (Round Current Ratio and Earnings per share to 2 decimal places, e.g. 15.25 and Debt to assets ratio to I decimal place, e.g. 78.9%. Enter negative amounts using either a negative sign preceding the number .. -45 or parentheses eg. (45).) (1) Working capital. (2016: $160,500) (10) Current ratio. (2016: 1.65:1) (II) Free cash flow. (2016: $48,700) (iv) Debt to assets ratio. (2016: 31%) (v) Earnings per share. (2016: $3.15) (0 Working capital $ (1) Current ratio : 1 (ii) Free cash flow (iv) Debt to assets ratio (v) Earnings per share $ Click if you would like to show Work for this question: Open Show Work


