

Answered step by step
Verified Expert Solution
Question
1 Approved Answer
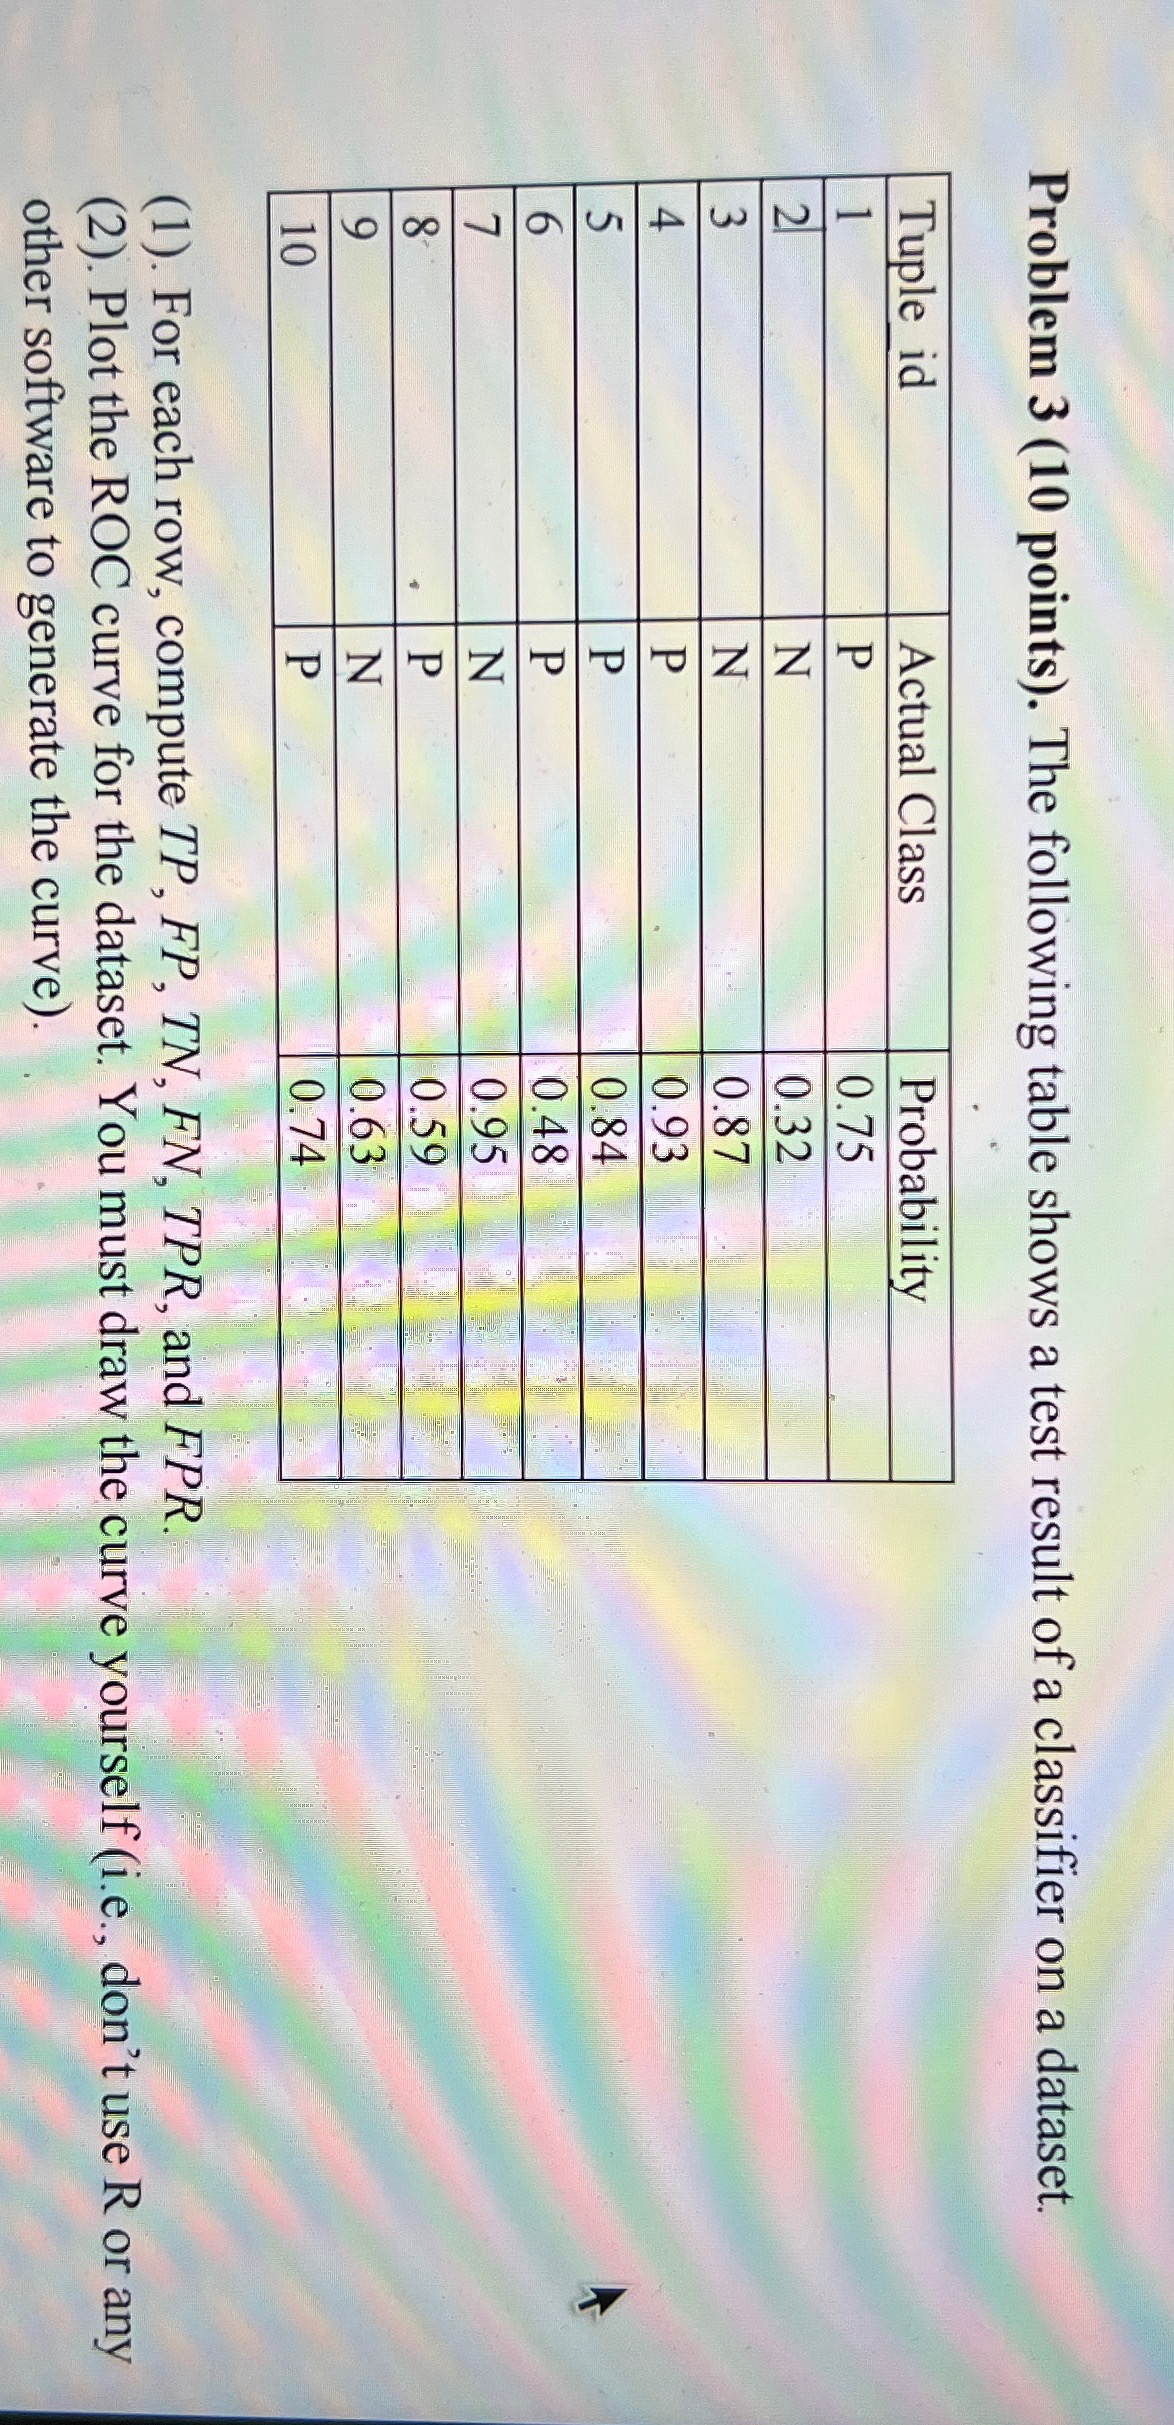
Problem 3 ( 1 0 points ) . The following table shows a test result of a classifier on a dataset. table [ [
Problem points The following table shows a test result of a classifier on a dataset.
tableTuple idActual Class,ProbabilityPNNPPPNPNP
For each row, compute and
Plot the ROC curve for the dataset. You must draw the curve yourself ie don't use R or any other software to generate the curve
Step by Step Solution
There are 3 Steps involved in it
Step: 1

Get Instant Access to Expert-Tailored Solutions
See step-by-step solutions with expert insights and AI powered tools for academic success
Step: 2

Step: 3
Ace Your Homework with AI
Get the answers you need in no time with our AI-driven, step-by-step assistance
Get Started
Advances In Database Technology Edbt 94 4th International Conference On Extending Database Technology Cambridge United Kingdom March 1994 Proceedings Lncs 779
Authors: Matthias Jarke ,Janis Bubenko ,Keith Jeffery
1994th Edition
3540578188, 978-3540578185