Question
Problem 3 (CAPM Model in Finance). In this problem, you will investigate the static capital asset pricing model (CAPM) of finance. This model holds that
Problem 3 (CAPM Model in Finance). In this problem, you will investigate the static capital asset pricing model (CAPM) of finance. This model holds that the excess return (i.e. the return in excess of the risk-free rate) on an asset is made up of two components, a systematic component and a diversifiable component. Let rm be a random variable representing the excess return on the market, and r be a random variable representing the excess return on some asset. Then the CAPM says that: (1) r = + rm +
In writing equation (??), I have followed the finance convention of denoting the intercept as and the slope as . In this equation, is the diversifiable component a random variable that cannot be predicted with information prior to date t. The CAPM presumes that the for a stock is not correlated with the for any other stock and hence is not correlated with rm.
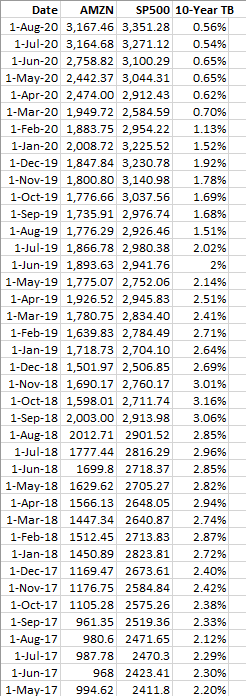
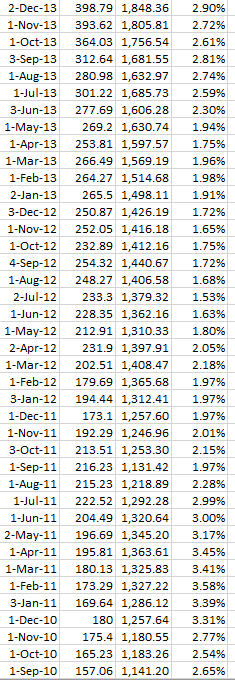
The variation in the return on the market, rm, is driven by changes in the economic environment. The systematic component of the return to the asset is the component associated with the market return. Coefficient in equation (??) is the assets beta in finance parlance. It is a measure of the systematic risk of the asset. For a given total expected return, an asset with a high beta is considered riskier than an asset with a low beta. Why? Suppose you buy equal amounts of shares in a large number of assets. Since the idiosyncratic return (s) on these assets are uncorrelated, the variance of the idiosyncratic component of your portfolio will go to zero as the number of assets held gets large thanks to the law of large numbers. In short, the risk on the component of the asset return r can be diversified away. This implies that the variance of the non-diversifiable component of r is just 2 times the variance of rm (Recall that Var( + rm) = 2 Var(rm) always holds when and are constants and rm is a random variable). As a consequence, assets with a larger beta have a larger non-diversifiable risk and should therefore have a larger expected return. We will compute alpha and beta for Amazon, using the data shown below..
(3.1) Using the data provided, compute the monthly rates of return on Amazons stock. Note that Amazon does not pay dividends, so the monthly rates of return can be computed directly from the stock prices in consecutive months. What is the beta of Amazon?
(3.2) Provide a 95% confidence interval for the beta of Amazon. Yahoo.finance claims that Amazons beta is 1.33. Test this hypothesis at the 5% significance level.
(3.3) Moderate. A prediction about the CAPM that will be developed in your finance class is that the intercept = 0 for any asset. What value of did you find in the regression performed in (3.1)? Test the hypothesis that = 0 at a 5% significance level. Is the prediction = 0 supported? (3.4) Moderate. Interpret the coefficient of determination R2 in terms of the systematic and diversifiable components of the risk.


Step by Step Solution
There are 3 Steps involved in it
Step: 1

Get Instant Access to Expert-Tailored Solutions
See step-by-step solutions with expert insights and AI powered tools for academic success
Step: 2

Step: 3

Ace Your Homework with AI
Get the answers you need in no time with our AI-driven, step-by-step assistance
Get Started


