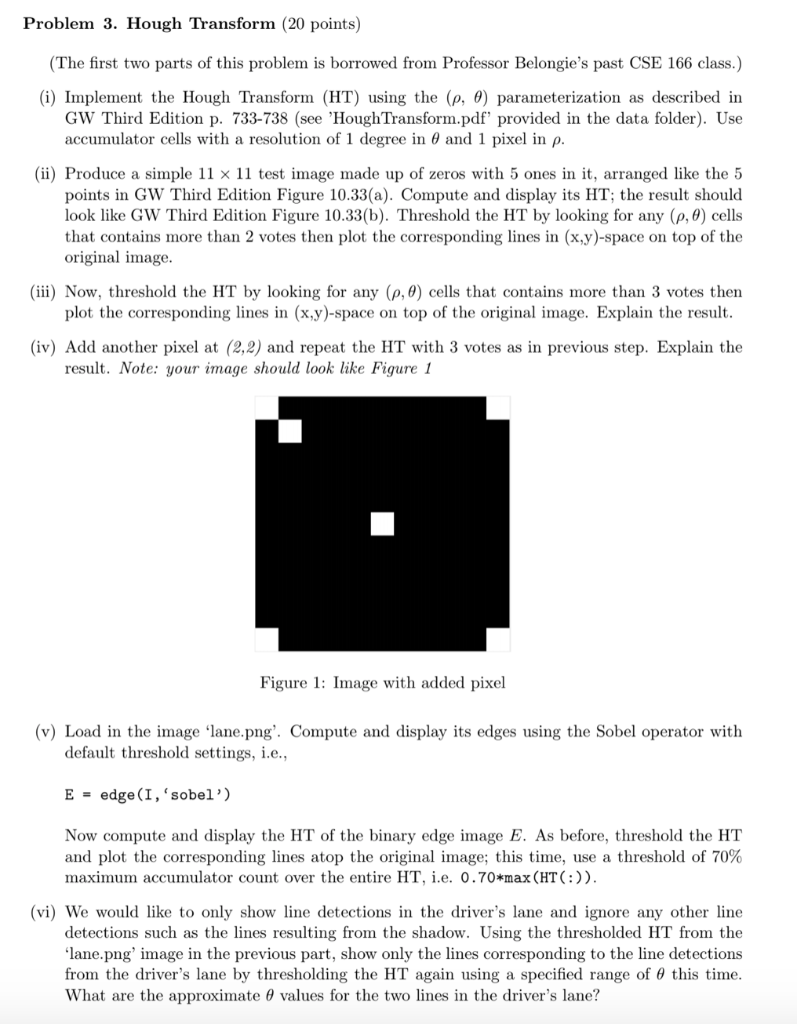
Problem 3. Hough Transform (20 points) The first two parts of this problem is borrowed from Professor Belongie's past CSE 166 class.) (i) Implement the Hough Transform (HT) using the (p, ) parameterization as described in GW Third Edition p. 733-738 (see 'HoughTransform.pdf' provided in the data folder). Use accum ulator cells with a resolution of 1 degree in and 1 pixel in (ii) Produce a simple 11 11 test image made up of zeros with 5 ones in it, arranged like the 5 points in GW Third Edition Figure 10.33(a). Compute and display its HT; the result should look like GW Third Edition Figure 10.33(b). Threshold the HT by looking for any (p,d) cells that contains more than 2 votes then plot the corresponding lines in (x.y)-space on top of the original image (iii) Now, threshold the HT by looking for any (p, 0) cells that contains more than 3 votes then plot the corresponding lines in (x,y)-space on top of the original image. Explain the result. (iv) Add another pixel at (2,2) and repeat the HT with 3 votes as in previous step. Explain the result. Note: your image should look like Figure 1 Figure 1: Image with added pixel (v) Load in the image 'lane.png'. Compute and display its edges using the Sobel operator with default threshold settings, i.e E-edge (I, 'sobel') Now compute and display the HT of the binary edge image E. As before, threshold the HT and plot the corresponding lines atop the original image: this time, use a threshold of 70% maximum accumulator count over the entire HT, .e. 0.70*max (HT(:)) (vi) We would like to only show line detections in the driver's lane and ignore any other line detections such as the lines resulting from the shadow. Using the thresholded HT from the lane.png' image in the previous part, show only the lines corresponding to the line detections from the driver's lane by thresholding the HT again using a specified range of this time What are the approximate values for the two lines in the driver's lane? Problem 3. Hough Transform (20 points) The first two parts of this problem is borrowed from Professor Belongie's past CSE 166 class.) (i) Implement the Hough Transform (HT) using the (p, ) parameterization as described in GW Third Edition p. 733-738 (see 'HoughTransform.pdf' provided in the data folder). Use accum ulator cells with a resolution of 1 degree in and 1 pixel in (ii) Produce a simple 11 11 test image made up of zeros with 5 ones in it, arranged like the 5 points in GW Third Edition Figure 10.33(a). Compute and display its HT; the result should look like GW Third Edition Figure 10.33(b). Threshold the HT by looking for any (p,d) cells that contains more than 2 votes then plot the corresponding lines in (x.y)-space on top of the original image (iii) Now, threshold the HT by looking for any (p, 0) cells that contains more than 3 votes then plot the corresponding lines in (x,y)-space on top of the original image. Explain the result. (iv) Add another pixel at (2,2) and repeat the HT with 3 votes as in previous step. Explain the result. Note: your image should look like Figure 1 Figure 1: Image with added pixel (v) Load in the image 'lane.png'. Compute and display its edges using the Sobel operator with default threshold settings, i.e E-edge (I, 'sobel') Now compute and display the HT of the binary edge image E. As before, threshold the HT and plot the corresponding lines atop the original image: this time, use a threshold of 70% maximum accumulator count over the entire HT, .e. 0.70*max (HT(:)) (vi) We would like to only show line detections in the driver's lane and ignore any other line detections such as the lines resulting from the shadow. Using the thresholded HT from the lane.png' image in the previous part, show only the lines corresponding to the line detections from the driver's lane by thresholding the HT again using a specified range of this time What are the approximate values for the two lines in the driver's lane