Question
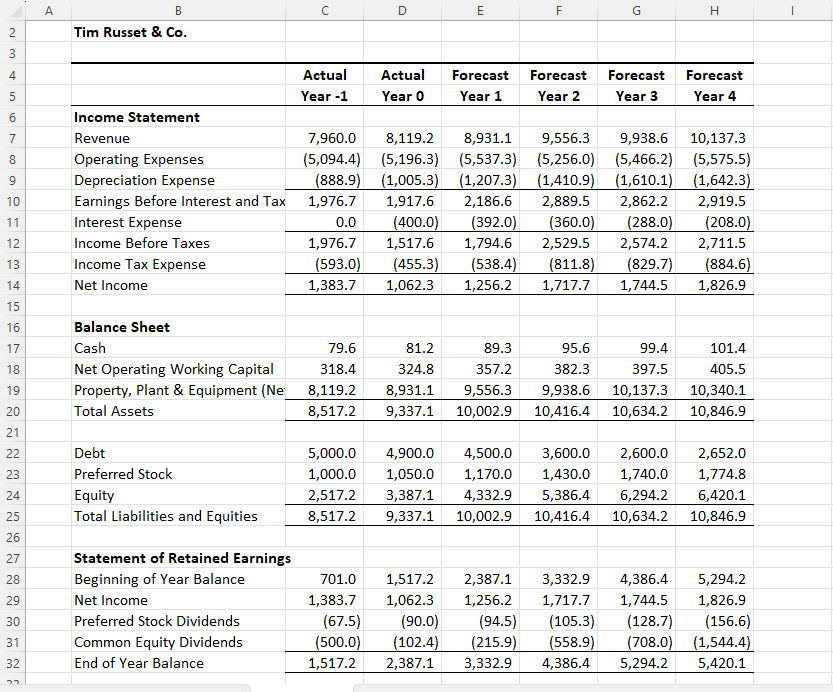
Problem 3 In the accompanying spreadsheet, on the worksheet labeled Problem 3, I provide income statements, statements of retained earnings, and balance sheets for Tim
Problem 3 In the accompanying spreadsheet, on the worksheet labeled Problem 3, I provide income statements, statements of retained earnings, and balance sheets for Tim Russet & Company (Russet). All of the cash flows occur at the end of each year, including capital expenditures and any financing transactions. The company distributes all equity free cash flows to equity holders in the form of dividends; in other words, it does not hold any excess cash. Its income tax rate is 30% on taxable income up to $2,000 and 40% on all additional taxable income. The interest rate the company pays on debt is 8%, and its preferred stock dividend rate is 9% (both based on the companys book value of debt and preferred stock). The company has no sales or retirements of property, plant, or equipment during the period covered by the exhibit. The cash line represents required cash. a) Calculate Russets unlevered free cash flow (Free cash flow to firm) and free cash flow to equity for Years 0 through 4. b) Compare the stability of the companys earnings before interest and taxes, net income,  unlevered free cash flows, and equity free cash flows.
\begin{tabular}{|c|c|c|c|c|c|c|c|c|} \hline & A & B & C & D & E & F & G & H \\ \hline 2 & & Tim Russet \& Co. & & & & & & \\ \hline \multicolumn{9}{|l|}{3} \\ \hline 4 & & & Actual & Actual & Forecast & Forecast & Forecast & Forecast \\ \hline 5 & & & Year -1 & Year 0 & Year 1 & Year 2 & Year 3 & Year 4 \\ \hline 6 & & Income Statement & & & & & & \\ \hline 7 & & Revenue & 7,960.0 & 8,119.2 & 8,931.1 & 9,556.3 & 9,938.6 & 10,137.3 \\ \hline 8 & & Operating Expenses & (5,094.4) & (5,196.3) & (5,537.3) & (5,256.0) & (5,466.2) & (5,575.5) \\ \hline 9 & & Depreciation Expense & (888.9) & (1,005.3) & (1,207.3) & (1,410.9) & (1,610.1) & (1,642.3) \\ \hline 10 & & Earnings Before Interest and Tax & 1,976.7 & 1,917.6 & 2,186.6 & 2,889.5 & 2,862.2 & 2,919.5 \\ \hline 11 & & Interest Expense & 0.0 & (400.0) & (392.0) & (360.0) & (288.0) & (208.0) \\ \hline 12 & & Income Before Taxes & 1,976.7 & 1,517.6 & 1,794.6 & 2,529.5 & 2,574.2 & 2,711.5 \\ \hline 13 & & Income Tax Expense & (593.0) & (455.3) & (538.4) & (811.8) & (829.7) & (884.6) \\ \hline 14 & & Net Income & 1,383.7 & 1,062.3 & 1,256.2 & 1,717.7 & 1,744.5 & 1,826.9 \\ \hline \multicolumn{9}{|l|}{15} \\ \hline 16 & & Balance Sheet & & & & & & \\ \hline 17 & & Cash & 79.6 & 81.2 & 89.3 & 95.6 & 99.4 & 101.4 \\ \hline 18 & & Net Operating Working Capital & 318.4 & 324.8 & 357.2 & 382.3 & 397.5 & 405.5 \\ \hline 19 & & Property, Plant \& Equipment ( Ne & 8,119.2 & 8,931.1 & 9,556.3 & 9,938.6 & 10,137.3 & 10,340.1 \\ \hline 20 & & Total Assets & 8,517.2 & 9,337.1 & 10,002.9 & 10,416.4 & 10,634.2 & 10,846.9 \\ \hline \multicolumn{9}{|l|}{21} \\ \hline 22 & & Debt & 5,000.0 & 4,900.0 & 4,500.0 & 3,600.0 & 2,600.0 & 2,652.0 \\ \hline 23 & & Preferred Stock & 1,000.0 & 1,050.0 & 1,170.0 & 1,430.0 & 1,740.0 & 1,774.8 \\ \hline 24 & & Equity & 2,517.2 & 3,387.1 & 4,332.9 & 5,386.4 & 6,294.2 & 6,420.1 \\ \hline 25 & & Total Liabilities and Equities & 8,517.2 & 9,337.1 & 10,002.9 & 10,416.4 & 10,634.2 & 10,846.9 \\ \hline \multicolumn{9}{|l|}{26} \\ \hline 27 & & Statement of Retained Earnings & & & & & & \\ \hline 28 & & Beginning of Year Balance & 701.0 & 1,517.2 & 2,387.1 & 3,332.9 & 4,386.4 & 5,294.2 \\ \hline 29 & & Net Income & 1,383.7 & 1,062.3 & 1,256.2 & 1,717.7 & 1,744.5 & 1,826.9 \\ \hline 30 & & Preferred Stock Dividends & (67.5) & (90.0) & (94.5) & (105.3) & (128.7) & (156.6) \\ \hline 31 & & Common Equity Dividends & (500.0) & (102.4) & (215.9) & (558.9) & (708.0) & (1,544.4) \\ \hline 32 & & End of Year Balance & 1,517.2 & 2,387.1 & 3,332.9 & 4,386.4 & 5,294.2 & 5,420.1 \\ \hline \end{tabular} \begin{tabular}{|c|c|c|c|c|c|c|c|c|} \hline & A & B & C & D & E & F & G & H \\ \hline 2 & & Tim Russet \& Co. & & & & & & \\ \hline \multicolumn{9}{|l|}{3} \\ \hline 4 & & & Actual & Actual & Forecast & Forecast & Forecast & Forecast \\ \hline 5 & & & Year -1 & Year 0 & Year 1 & Year 2 & Year 3 & Year 4 \\ \hline 6 & & Income Statement & & & & & & \\ \hline 7 & & Revenue & 7,960.0 & 8,119.2 & 8,931.1 & 9,556.3 & 9,938.6 & 10,137.3 \\ \hline 8 & & Operating Expenses & (5,094.4) & (5,196.3) & (5,537.3) & (5,256.0) & (5,466.2) & (5,575.5) \\ \hline 9 & & Depreciation Expense & (888.9) & (1,005.3) & (1,207.3) & (1,410.9) & (1,610.1) & (1,642.3) \\ \hline 10 & & Earnings Before Interest and Tax & 1,976.7 & 1,917.6 & 2,186.6 & 2,889.5 & 2,862.2 & 2,919.5 \\ \hline 11 & & Interest Expense & 0.0 & (400.0) & (392.0) & (360.0) & (288.0) & (208.0) \\ \hline 12 & & Income Before Taxes & 1,976.7 & 1,517.6 & 1,794.6 & 2,529.5 & 2,574.2 & 2,711.5 \\ \hline 13 & & Income Tax Expense & (593.0) & (455.3) & (538.4) & (811.8) & (829.7) & (884.6) \\ \hline 14 & & Net Income & 1,383.7 & 1,062.3 & 1,256.2 & 1,717.7 & 1,744.5 & 1,826.9 \\ \hline \multicolumn{9}{|l|}{15} \\ \hline 16 & & Balance Sheet & & & & & & \\ \hline 17 & & Cash & 79.6 & 81.2 & 89.3 & 95.6 & 99.4 & 101.4 \\ \hline 18 & & Net Operating Working Capital & 318.4 & 324.8 & 357.2 & 382.3 & 397.5 & 405.5 \\ \hline 19 & & Property, Plant \& Equipment ( Ne & 8,119.2 & 8,931.1 & 9,556.3 & 9,938.6 & 10,137.3 & 10,340.1 \\ \hline 20 & & Total Assets & 8,517.2 & 9,337.1 & 10,002.9 & 10,416.4 & 10,634.2 & 10,846.9 \\ \hline \multicolumn{9}{|l|}{21} \\ \hline 22 & & Debt & 5,000.0 & 4,900.0 & 4,500.0 & 3,600.0 & 2,600.0 & 2,652.0 \\ \hline 23 & & Preferred Stock & 1,000.0 & 1,050.0 & 1,170.0 & 1,430.0 & 1,740.0 & 1,774.8 \\ \hline 24 & & Equity & 2,517.2 & 3,387.1 & 4,332.9 & 5,386.4 & 6,294.2 & 6,420.1 \\ \hline 25 & & Total Liabilities and Equities & 8,517.2 & 9,337.1 & 10,002.9 & 10,416.4 & 10,634.2 & 10,846.9 \\ \hline \multicolumn{9}{|l|}{26} \\ \hline 27 & & Statement of Retained Earnings & & & & & & \\ \hline 28 & & Beginning of Year Balance & 701.0 & 1,517.2 & 2,387.1 & 3,332.9 & 4,386.4 & 5,294.2 \\ \hline 29 & & Net Income & 1,383.7 & 1,062.3 & 1,256.2 & 1,717.7 & 1,744.5 & 1,826.9 \\ \hline 30 & & Preferred Stock Dividends & (67.5) & (90.0) & (94.5) & (105.3) & (128.7) & (156.6) \\ \hline 31 & & Common Equity Dividends & (500.0) & (102.4) & (215.9) & (558.9) & (708.0) & (1,544.4) \\ \hline 32 & & End of Year Balance & 1,517.2 & 2,387.1 & 3,332.9 & 4,386.4 & 5,294.2 & 5,420.1 \\ \hline \end{tabular}
Step by Step Solution
There are 3 Steps involved in it
Step: 1

Get Instant Access to Expert-Tailored Solutions
See step-by-step solutions with expert insights and AI powered tools for academic success
Step: 2

Step: 3

Ace Your Homework with AI
Get the answers you need in no time with our AI-driven, step-by-step assistance
Get Started


