Answered step by step
Verified Expert Solution
Question
1 Approved Answer
Problem. 3 The following data (next page) was taken by a student in ME4053 to measure the speed of sound. The first column gives the
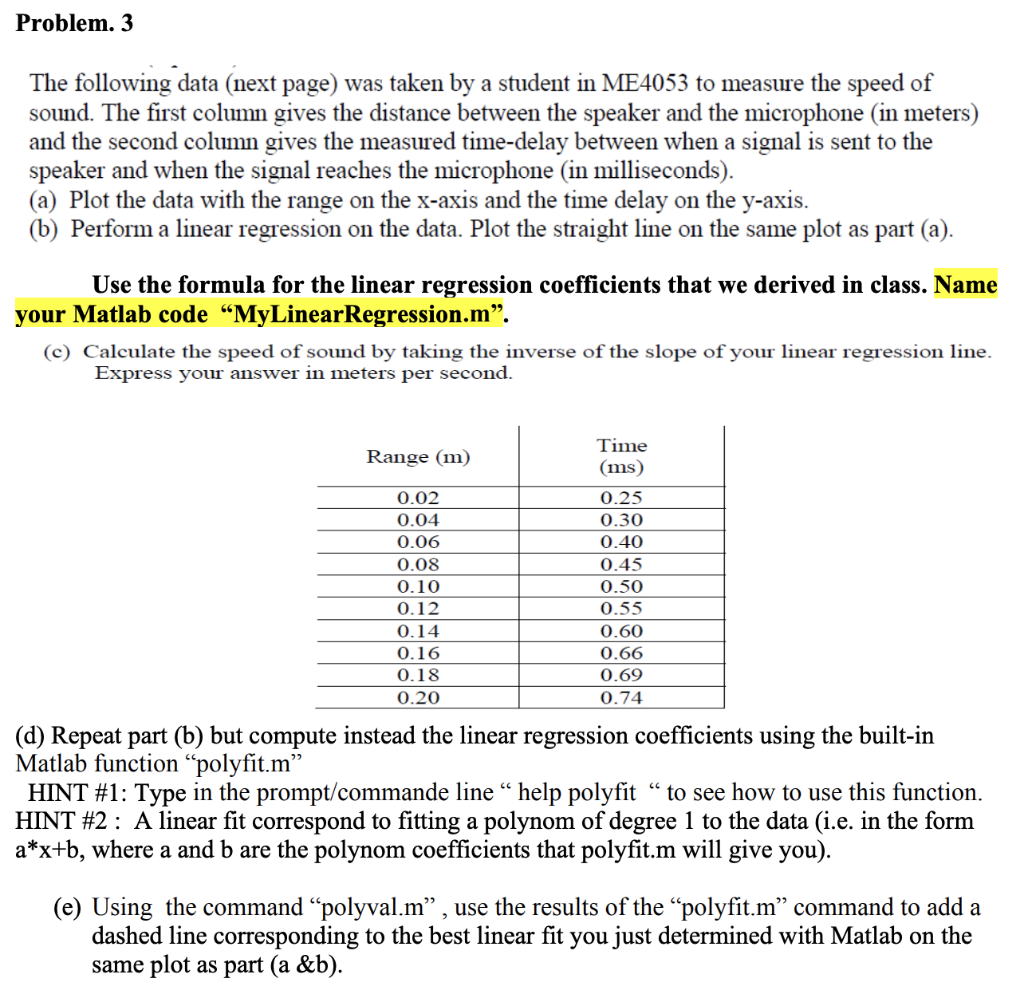
Problem. 3 The following data (next page) was taken by a student in ME4053 to measure the speed of sound. The first column gives the distance between the speaker and the microphone (in meters) and the second column gives the measured time-delay between when a signal is sent to the speaker and when the signal reaches the microphone (in milliseconds) (a) Plot the data with the range on the x-axis and the time delay on the y-axis (b) Perform a linear regression on the data. Plot the straight line on the same plot as part (a) Use the formula for the linear regression coefficients that we derived in class. Name your Matlab code MyLinearRegression.m". (c) Calculate the speed of sound by taking the inverse of the slope of your linear regression line. Express your answer in meters per second Time ms 0.25 0.30 0.40 0.45 0.50 0.55 0.60 0.66 0.69 0.74 Range (m 0.02 0.04 0.06 0.08 0.10 0.12 0.14 0.16 0.18 0.20 (d) Repeat part (b) but compute instead the linear regression coefficients using the built-in Matlab function "polvfit.m HINT #1 : Type in the prompt/commande line " help polyfit " to see how to use this function. HINT #2 : A linear fit correspond to fitting a polynom of degree l to the data (ie. in the form a*x+b, where a and b are the polynom coefficients that polyfit.m will give you) (e) Using the command "polyval.m" , use the results of the "polyfit.m" command to add a dashed line corresponding to the best linear fit you just determined with Matlab on the same plot as part (a &b)
Step by Step Solution
There are 3 Steps involved in it
Step: 1
Get Instant Access to Expert-Tailored Solutions
See step-by-step solutions with expert insights and AI powered tools for academic success
Step: 2
Step: 3
Ace Your Homework with AI
Get the answers you need in no time with our AI-driven, step-by-step assistance
Get Started