

Answered step by step
Verified Expert Solution
Question
1 Approved Answer
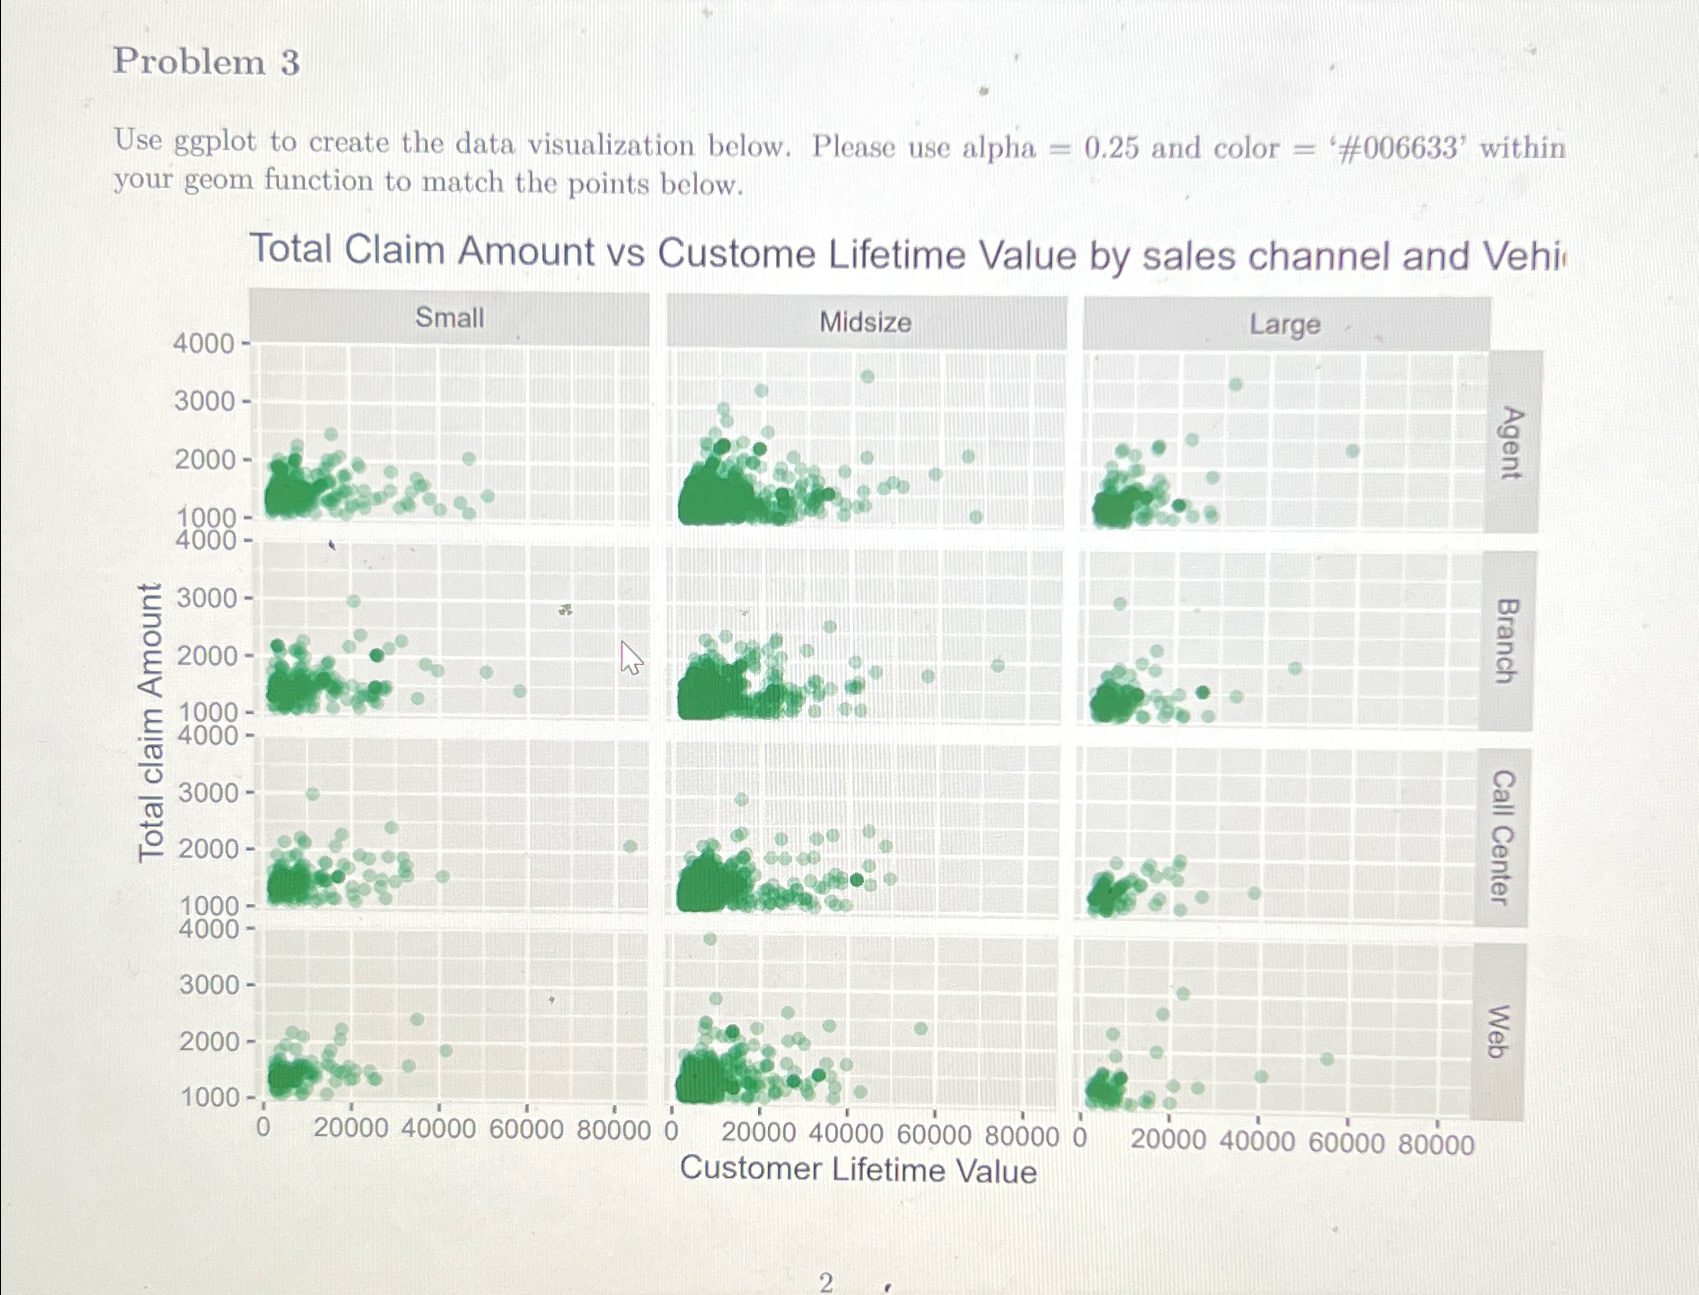
Problem 3 Use ggplot to create the data visualization below. Please use alpha = 0 . 2 5 and color = ' # 0 0
Problem
Use ggplot to create the data visualization below. Please use alpha and color # within your geom function to match the points below.
Total Claim Amount vs Custome Lifetime Value by sales channel and Vehi
Step by Step Solution
There are 3 Steps involved in it
Step: 1

Get Instant Access to Expert-Tailored Solutions
See step-by-step solutions with expert insights and AI powered tools for academic success
Step: 2

Step: 3
Ace Your Homework with AI
Get the answers you need in no time with our AI-driven, step-by-step assistance
Get Started
Database Concepts
Authors: David Kroenke
4th Edition
0136086535, 9780136086536