

Answered step by step
Verified Expert Solution
Question
1 Approved Answer
Problem 3.5 Four cases of data are provided to you in the file data.mat along with your manual: 1. A spring mass damper system was
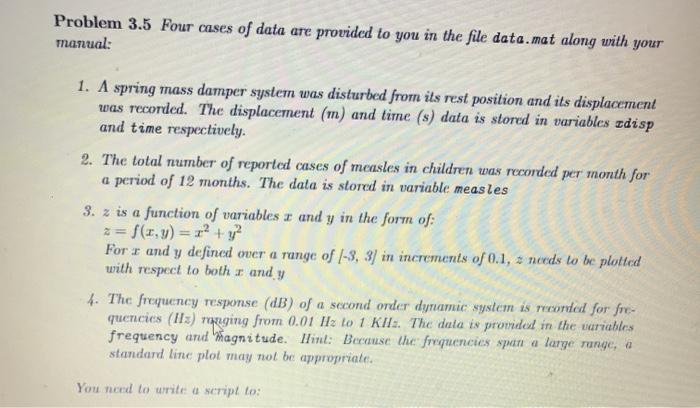
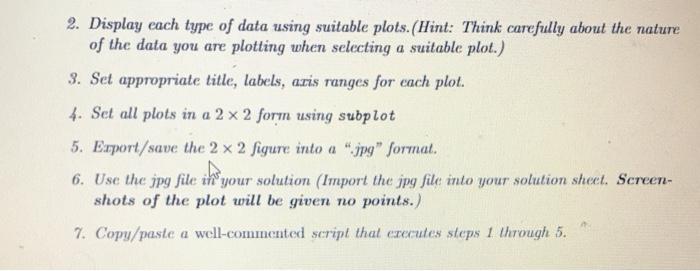
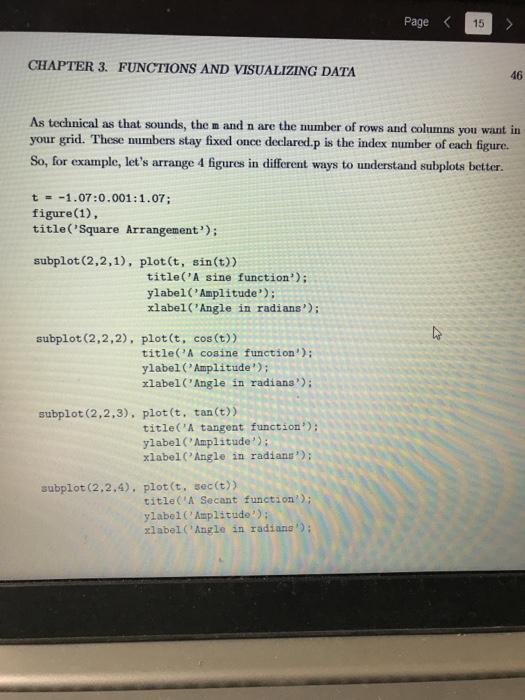
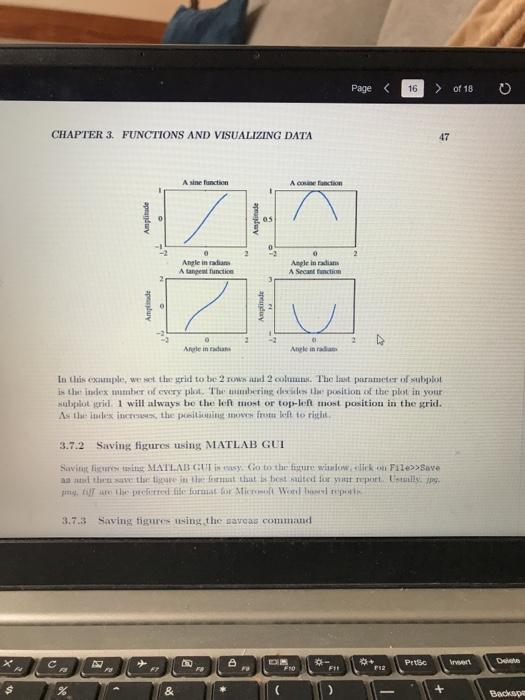
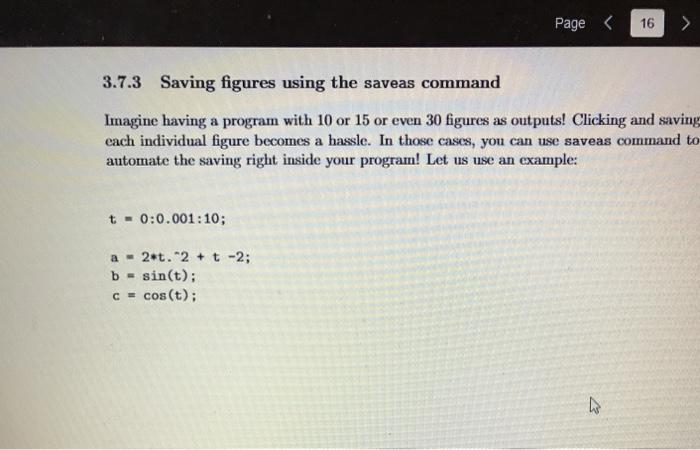
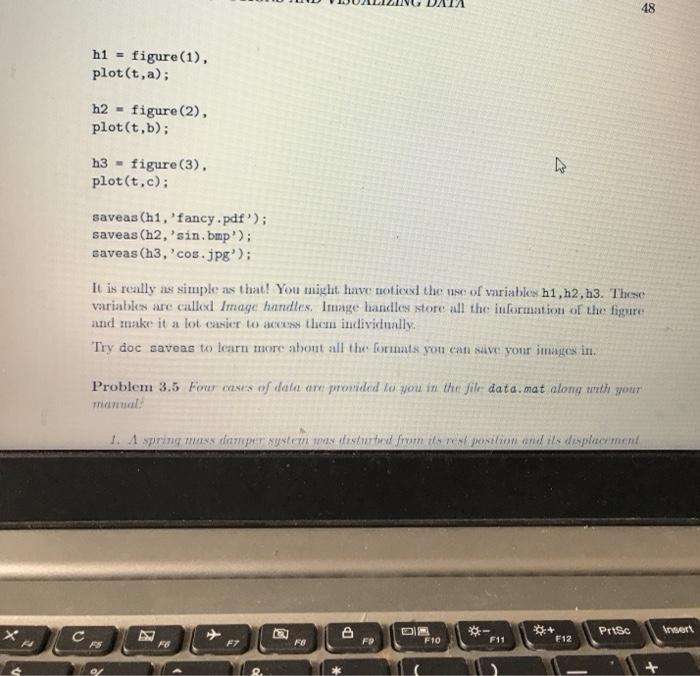 Problem 3.5 Four cases of data are provided to you in the file data.mat along with your manual: 1. A spring mass damper system was disturbed from its rest position and its displacement was recorded. The displacement (m) and time (s) data is stored in variables Edisp and time respectively. 2. The total number of reported cases of measles in children was recorded per month for a period of 12 months. The data is stored in variable measles 3. z is a function of variables I and y in the form of: = f(x,y)=ra + y2 For r and y defined over a range of 1-3, 3) in increments of 0.1, needs to be plotted with respect to both and y 4. The frequency response (dB) of a second order dynamic system is recorded for fre- quencics (II:) manging from 0.01 Hz to 1 KHz. The data is provided in the wariables frequency and magnitude. In: Because the frequencies spain a large range, a standard line plot may not be appropriate. You need to write a script to: 2. Display each type of data using suitable plots. (Hint: Think carefully about the nature of the data you are plotting when selecting a suitable plot.) 3. Set appropriate title, labels, acis ranges for each plot. 4. Set all plots in a 2 x 2 form using subplot 5. Export/save the 2 x 2 figure into a "jpg" format. 6. Use the jpg file the your solution (Import the jpg file into your solution sheet. Screen- shots of the plot will be given no points.) 7. Copy/paste a well-commented script that executes steps 1 through 5. Page > title(' Secant function); ylabel' Amplitude): xlabelAngle in radiana'); Page C 16 of 18 CHAPTER 3. FUNCTIONS AND VISUALIZING DATA 47 A sine fonction Am tamilar 11 2 Anplein adam A tangent 0 Anple in radian A Second function Ampide Amplitude 2 Arlind Anele in In this example, we set the grid to be one and 2 columns. The last parameter of subplot in the index mumber of ewry plot. The numbering the position of the plot in your subplot grid. I will always be the left most or top-le most position in the grid. As the best the promove from bot to right 3.7.2 Saving figures using MATLAB GUI Savite lige ting MATLAB CU Go to the figure widow, click ou File>Save a then startare at that is best multed for yet report sms mine the preferred life format for Mit Woodporn 3.7.3 Saving figures using the caveas command C A + F12 Petec Drials FNO F11 % & + Bacape Page > title(' Secant function); ylabel' Amplitude): xlabelAngle in radiana'); Page C 16 of 18 CHAPTER 3. FUNCTIONS AND VISUALIZING DATA 47 A sine fonction Am tamilar 11 2 Anplein adam A tangent 0 Anple in radian A Second function Ampide Amplitude 2 Arlind Anele in In this example, we set the grid to be one and 2 columns. The last parameter of subplot in the index mumber of ewry plot. The numbering the position of the plot in your subplot grid. I will always be the left most or top-le most position in the grid. As the best the promove from bot to right 3.7.2 Saving figures using MATLAB GUI Savite lige ting MATLAB CU Go to the figure widow, click ou File>Save a then startare at that is best multed for yet report sms mine the preferred life format for Mit Woodporn 3.7.3 Saving figures using the caveas command C A + F12 Petec Drials FNO F11 % & + Bacape Page
Step by Step Solution
There are 3 Steps involved in it
Step: 1

Get Instant Access to Expert-Tailored Solutions
See step-by-step solutions with expert insights and AI powered tools for academic success
Step: 2

Step: 3
Ace Your Homework with AI
Get the answers you need in no time with our AI-driven, step-by-step assistance
Get Started
Readings In Database Systems
Authors: Michael Stonebraker
2nd Edition
0934613656, 9780934613651