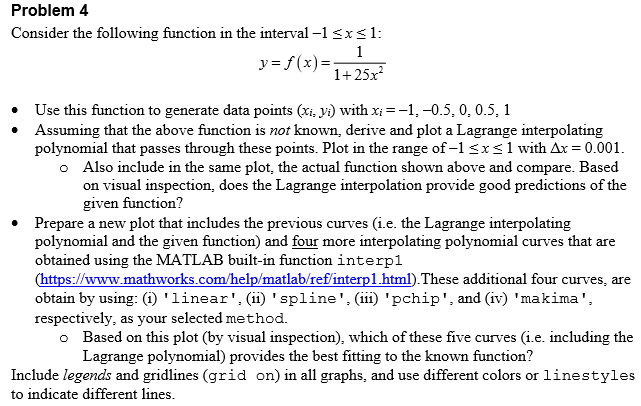
Problem 4 Consider the following function in the interval -1sxs 1 1+25x2 Use this function to generate data points (x,y) with x,--1,-05, 0,05, 1 Assuming that the above function is not known, derive and plot a Lagrange interpolating polynomial that passes through these points. Plot in the range of-1 x 1 with ??-0.001 Also include in the same plot, the actual function shown above and compare. Based on visual inspection, does the Lagrange interpolation provide good predictions of the given function? o Prepare a new plot that includes the previous curves (i.e. the Lagrange interpolating polynomial and the given function) and four more interpolating polynomial curves that are obtained using the MATLAB built-in function interpl (https://www.mathworks.com/help/matlab/refinterp1.html).These additional four curves, are obtain by using: (i) ' linear . (ii) ' spline ' , (iii) 'pchip ' , and (iv) ' makina . respectively, as your selected method. o Based on this plot (by visual inspection), which of these five curves (i.e. including the Lagrange polynomial) provides the best fitting to the known function? Include legends and gridlines (grid on) in all graphs, and use different colors or linestyles to indicate different lin Problem 4 Consider the following function in the interval -1sxs 1 1+25x2 Use this function to generate data points (x,y) with x,--1,-05, 0,05, 1 Assuming that the above function is not known, derive and plot a Lagrange interpolating polynomial that passes through these points. Plot in the range of-1 x 1 with ??-0.001 Also include in the same plot, the actual function shown above and compare. Based on visual inspection, does the Lagrange interpolation provide good predictions of the given function? o Prepare a new plot that includes the previous curves (i.e. the Lagrange interpolating polynomial and the given function) and four more interpolating polynomial curves that are obtained using the MATLAB built-in function interpl (https://www.mathworks.com/help/matlab/refinterp1.html).These additional four curves, are obtain by using: (i) ' linear . (ii) ' spline ' , (iii) 'pchip ' , and (iv) ' makina . respectively, as your selected method. o Based on this plot (by visual inspection), which of these five curves (i.e. including the Lagrange polynomial) provides the best fitting to the known function? Include legends and gridlines (grid on) in all graphs, and use different colors or linestyles to indicate different lin


