Answered step by step
Verified Expert Solution
Question
1 Approved Answer
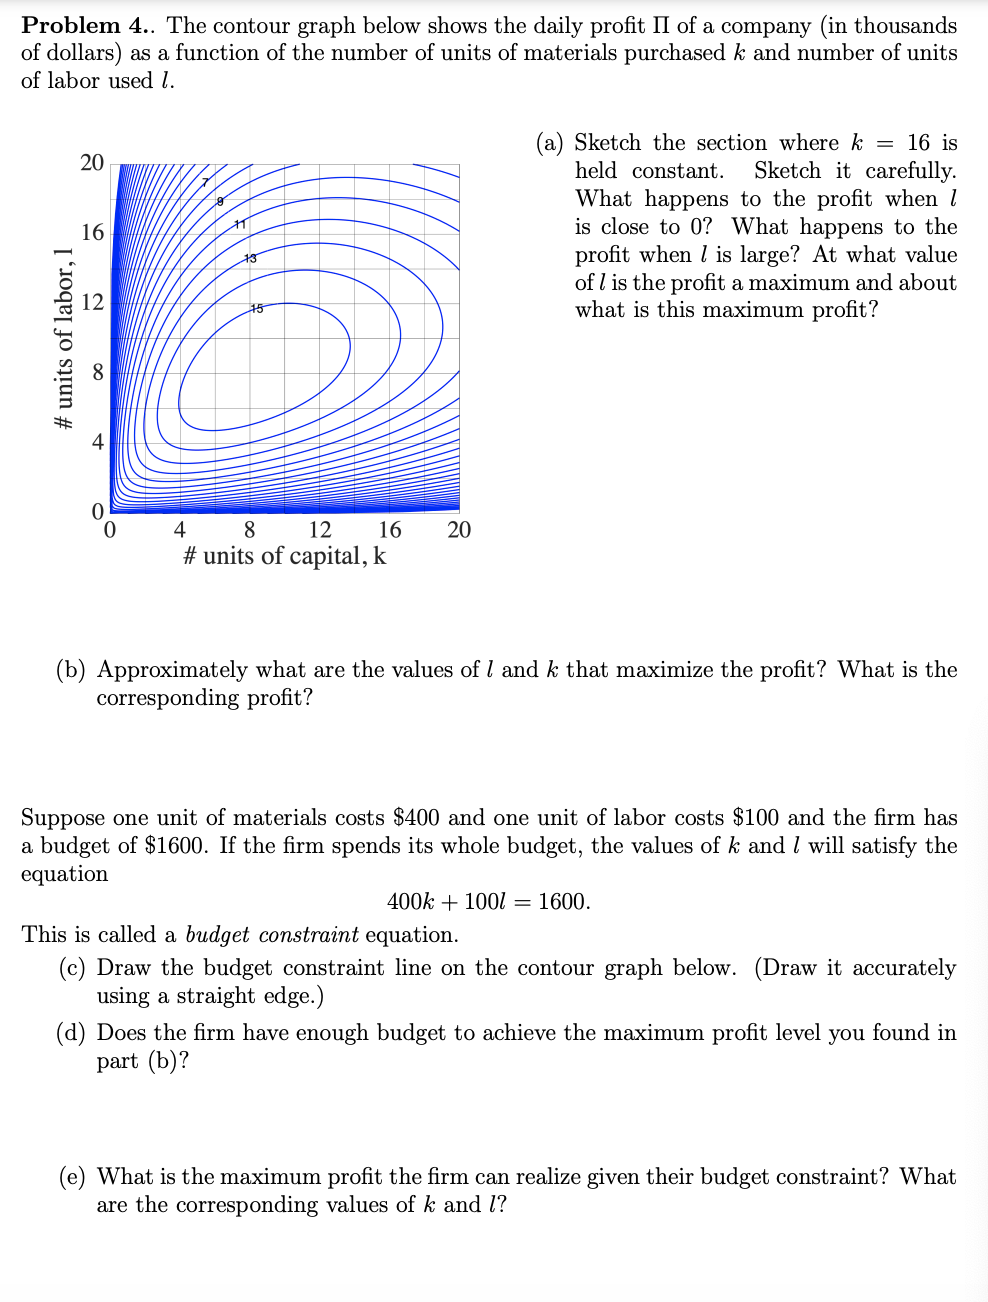
Problem 4.. The contour graph below shows the daily profit of a company (in thousands of dollars) as a function of the number of units
 Problem 4.. The contour graph below shows the daily profit of a company (in thousands of dollars) as a function of the number of units of materials purchased k and number of units of labor used l. (a) Sketch the section where k=16 is held constant. Sketch it carefully. What happens to the profit when l is close to 0 ? What happens to the profit when l is large? At what value of l is the profit a maximum and about what is this maximum profit? (b) Approximately what are the values of l and k that maximize the profit? What is the corresponding profit? Suppose one unit of materials costs $400 and one unit of labor costs $100 and the firm has a budget of $1600. If the firm spends its whole budget, the values of k and l will satisfy the equation 400k+100l=1600 This is called a budget constraint equation. (c) Draw the budget constraint line on the contour graph below. (Draw it accurately using a straight edge.) (d) Does the firm have enough budget to achieve the maximum profit level you found in part (b)? (e) What is the maximum profit the firm can realize given their budget constraint? What are the corresponding values of k and l
 Step by Step Solution
There are 3 Steps involved in it
Step: 1

Get Instant Access to Expert-Tailored Solutions
See step-by-step solutions with expert insights and AI powered tools for academic success
Step: 2

Step: 3

Ace Your Homework with AI
Get the answers you need in no time with our AI-driven, step-by-step assistance
Get Started


