Answered step by step
Verified Expert Solution
Link Copied!

Question

1 Approved Answer

Problem 5. Data were collected on the number of teaching strategies employed by Graduate Teaching Assistants. There were a total of 28 TAs who had
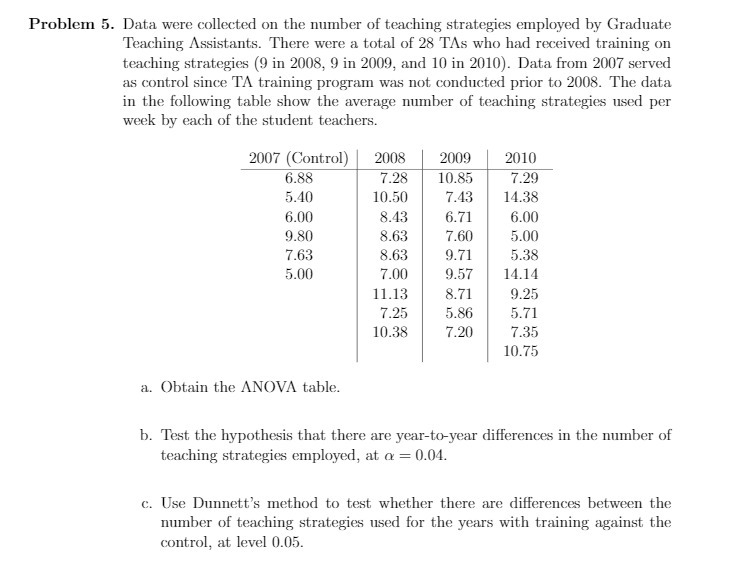
image text in transcribed
Problem 5. Data were collected on the number of teaching strategies employed by Graduate Teaching Assistants. There were a total of 28 TAs who had received training on teaching strategies (9 in 2008, 9 in 2009, and 10 in 2010). Data from 2007 served as control since TA training program was not conducted prior to 2008. The data in the following table show the average number of teaching strategies used per week by each of the student teachers. 2007 (Control) 2008 2009 2010 6.88 7.28 10.85 7.29 5.40 10.50 7.43 14.38 6.00 8.43 6.71 6.00 9.80 8.63 7.60 5.00 7.63 8.63 9.71 5.38 5.00 7.00 9.57 14.14 11.13 8.71 9.25 7.25 5.86 5.71 10.38 7.20 7.35 10.75 a. Obtain the ANOVA table. b. Test the hypothesis that there are year-to-year differences in the number of teaching strategies employed, at o = 0.04. c. Use Dunnett's method to test whether there are differences between the number of teaching strategies used for the years with training against the control, at level 0.05

Step by Step Solution

There are 3 Steps involved in it

Step: 1

blur-text-image

Get Instant Access to Expert-Tailored Solutions

See step-by-step solutions with expert insights and AI powered tools for academic success

Step: 2

blur-text-image

Step: 3

blur-text-image

Ace Your Homework with AI

Get the answers you need in no time with our AI-driven, step-by-step assistance

Get Started

Recommended Textbook for

An Introduction to the Mathematics of financial Derivatives

Authors: Salih N. Neftci

2nd Edition

978-0125153928, 9780080478647, 125153929, 978-0123846822

More Books

Students also viewed these Mathematics questions