Answered step by step
Verified Expert Solution
Question
1 Approved Answer
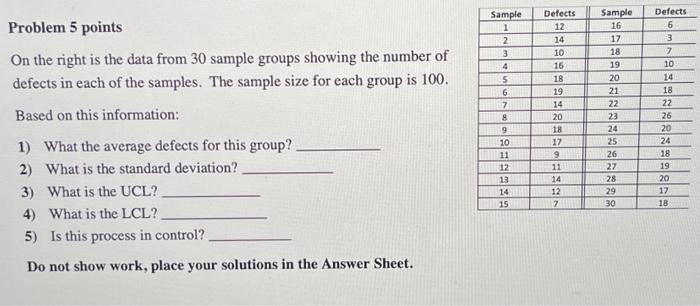
Problem 5 points On the right is the data from 30 sample groups showing the number of defects in each of the samples. The sample
Problem 5 points On the right is the data from 30 sample groups showing the number of defects in each of the samples. The sample size for each group is 100. Based on this information: 1) What the average defects for this group? 2) What is the standard deviation? 3) What is the UCL? 4) What is the LCL? 5) Is this process in control? Do not show work, place your solutions in the Answer Sheet. Sample 1 2 3 4 5 6 7 8 9 10 11 12 13 14 15 Defects 12 14 10 16 18 19 14 20 18 17 9 11 14 12 7 Sample 16 17 18 19 20 21 22 23 24 25 26 27 28 29 30 Defects 6 3 7 10 14 18 22 26 20 24 18 19 20 17 18

Step by Step Solution
There are 3 Steps involved in it
Step: 1

Get Instant Access to Expert-Tailored Solutions
See step-by-step solutions with expert insights and AI powered tools for academic success
Step: 2

Step: 3

Ace Your Homework with AI
Get the answers you need in no time with our AI-driven, step-by-step assistance
Get Started


