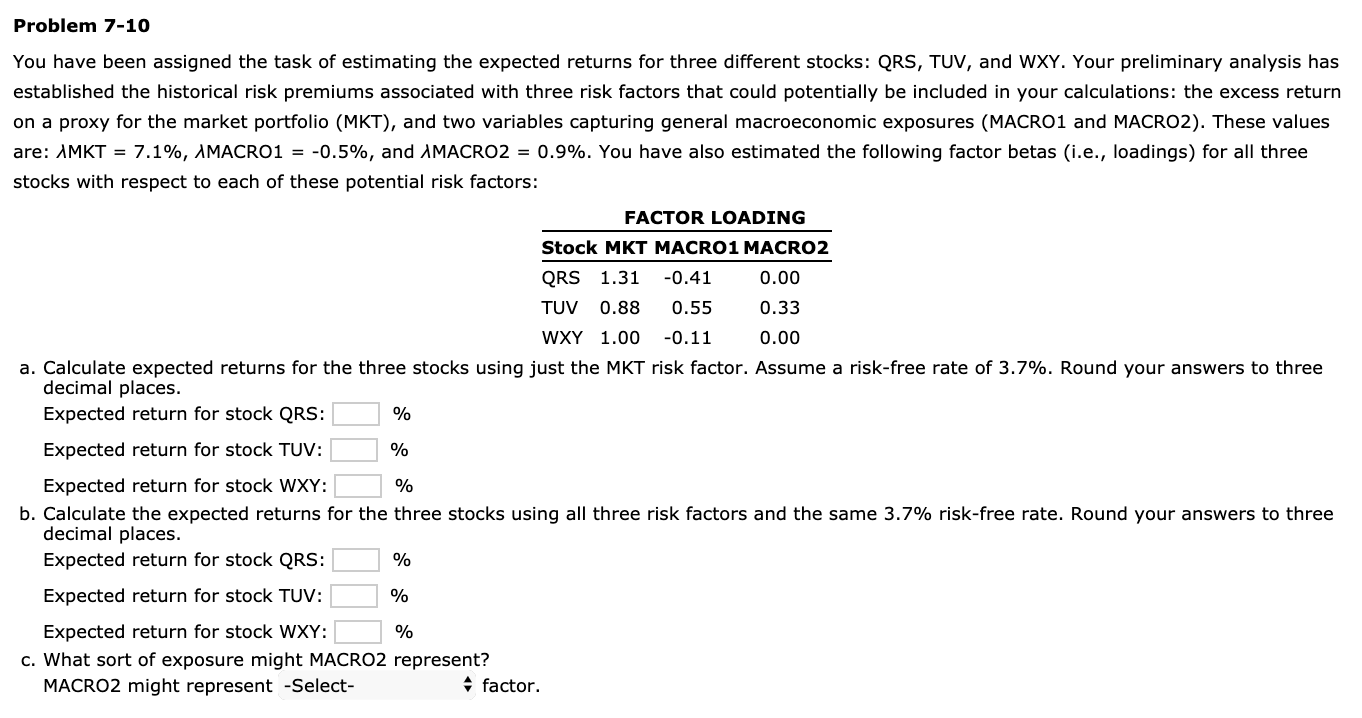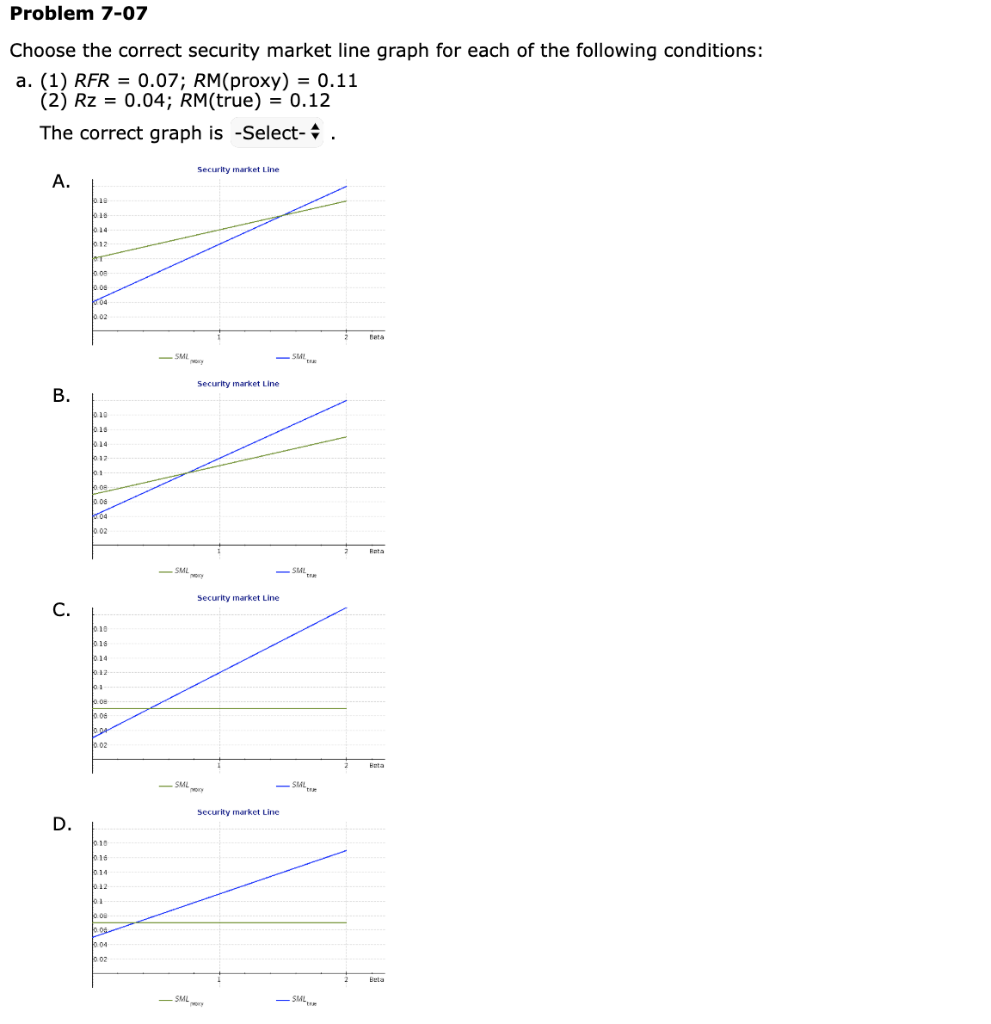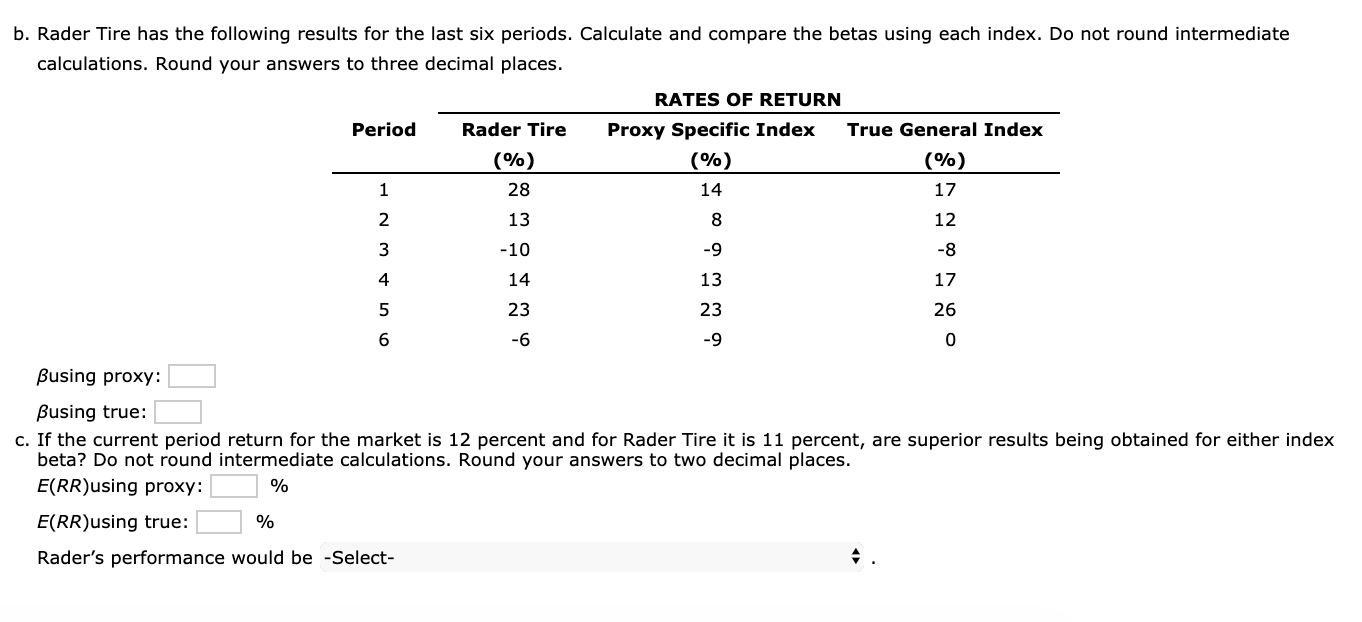


Problem 7-10 You have been assigned the task of estimating the expected returns for three different stocks: QRS, TUV, and WXY. Your preliminary analysis has established the historical risk premiums associated with three risk factors that could potentially be included in your calculations: the excess return on a proxy for the market portfolio (MKT), and two variables capturing general macroeconomic exposures (MACRO1 and MACRO2). These values are: MKT = 7.1%, IMACRO1 = -0.5%, and AMACRO2 = 0.9%. You have also estimated the following factor betas (i.e., loadings) for all three stocks with respect to each of these potential risk factors: FACTOR LOADING Stock MKT MACRO1 MACRO2 QRS 1.31 -0.41 0.00 TUV 0.88 0.55 0.33 WXY 1.00 -0.11 0.00 a. Calculate expected returns for the three stocks using just the MKT risk factor. Assume a risk-free rate of 3.7%. Round your answers to three decimal places. Expected return for stock QRS: Expected return for stock TUV: % Expected return for stock WXY: % b. Calculate the expected returns for the three stocks using all three risk factors and the same 3.7% risk-free rate. Round your answers to three decimal places. Expected return for stock QRS: Expected return for stock TUV: Expected return for stock WXY: % c. What sort of exposure might MACRO2 represent? MACRO2 might represent -Select- factor Problem 7-07 Choose the correct security market line graph for each of the following conditions: a. (1) RFR = 0.07; RM(proxy) = 0.11 (2) Rz = 0.04; RM(true) = 0.12 The correct graph is -Select- : . Security market Line A. SME SML Security market Line B. Security market Line SML - SML Security market Line SML - SML b. Rader Tire has the following results for the last six periods. Calculate and compare the betas using each index. Do not round intermediate calculations. Round your answers to three decimal places. RATES OF RETURN Period Rader Tire Proxy Specific Index True General Index (%) (%) 28 (%) $ 0 ? ? ? ? Busing proxy: Busing true: c. If the current period return for the market is 12 percent and for Rader Tire it is 11 percent, are superior results being obtained for either index beta? Do not round intermediate calculations. Round your answers to two decimal places. E(RR)using proxy: % E(RR)using true: % Rader's performance would be -Select- Problem 7-10 You have been assigned the task of estimating the expected returns for three different stocks: QRS, TUV, and WXY. Your preliminary analysis has established the historical risk premiums associated with three risk factors that could potentially be included in your calculations: the excess return on a proxy for the market portfolio (MKT), and two variables capturing general macroeconomic exposures (MACRO1 and MACRO2). These values are: MKT = 7.1%, IMACRO1 = -0.5%, and AMACRO2 = 0.9%. You have also estimated the following factor betas (i.e., loadings) for all three stocks with respect to each of these potential risk factors: FACTOR LOADING Stock MKT MACRO1 MACRO2 QRS 1.31 -0.41 0.00 TUV 0.88 0.55 0.33 WXY 1.00 -0.11 0.00 a. Calculate expected returns for the three stocks using just the MKT risk factor. Assume a risk-free rate of 3.7%. Round your answers to three decimal places. Expected return for stock QRS: Expected return for stock TUV: % Expected return for stock WXY: % b. Calculate the expected returns for the three stocks using all three risk factors and the same 3.7% risk-free rate. Round your answers to three decimal places. Expected return for stock QRS: Expected return for stock TUV: Expected return for stock WXY: % c. What sort of exposure might MACRO2 represent? MACRO2 might represent -Select- factor Problem 7-07 Choose the correct security market line graph for each of the following conditions: a. (1) RFR = 0.07; RM(proxy) = 0.11 (2) Rz = 0.04; RM(true) = 0.12 The correct graph is -Select- : . Security market Line A. SME SML Security market Line B. Security market Line SML - SML Security market Line SML - SML b. Rader Tire has the following results for the last six periods. Calculate and compare the betas using each index. Do not round intermediate calculations. Round your answers to three decimal places. RATES OF RETURN Period Rader Tire Proxy Specific Index True General Index (%) (%) 28 (%) $ 0 ? ? ? ? Busing proxy: Busing true: c. If the current period return for the market is 12 percent and for Rader Tire it is 11 percent, are superior results being obtained for either index beta? Do not round intermediate calculations. Round your answers to two decimal places. E(RR)using proxy: % E(RR)using true: % Rader's performance would be -Select


