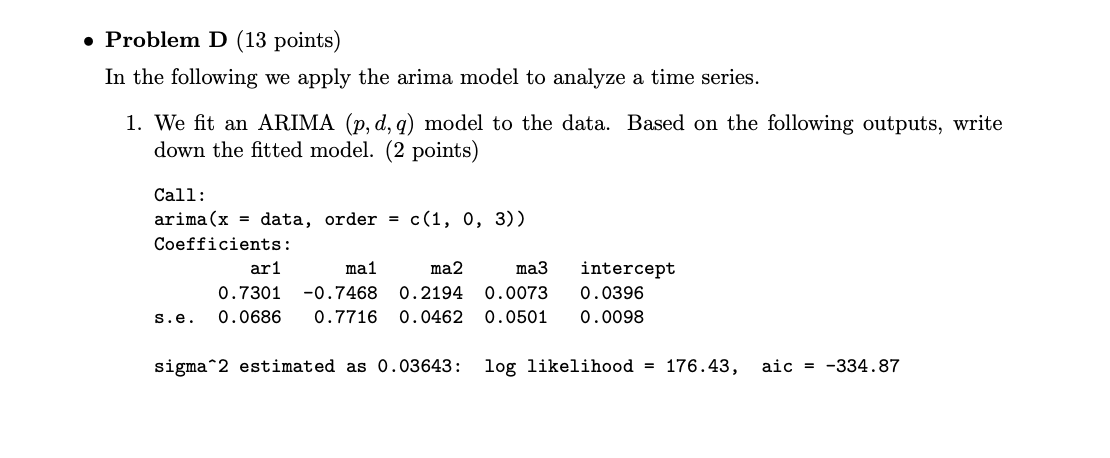
Question: Problem D (13 points) In the following we apply the arima model to analyze a time series. 1. We fit an ARIMA (p, d, q)


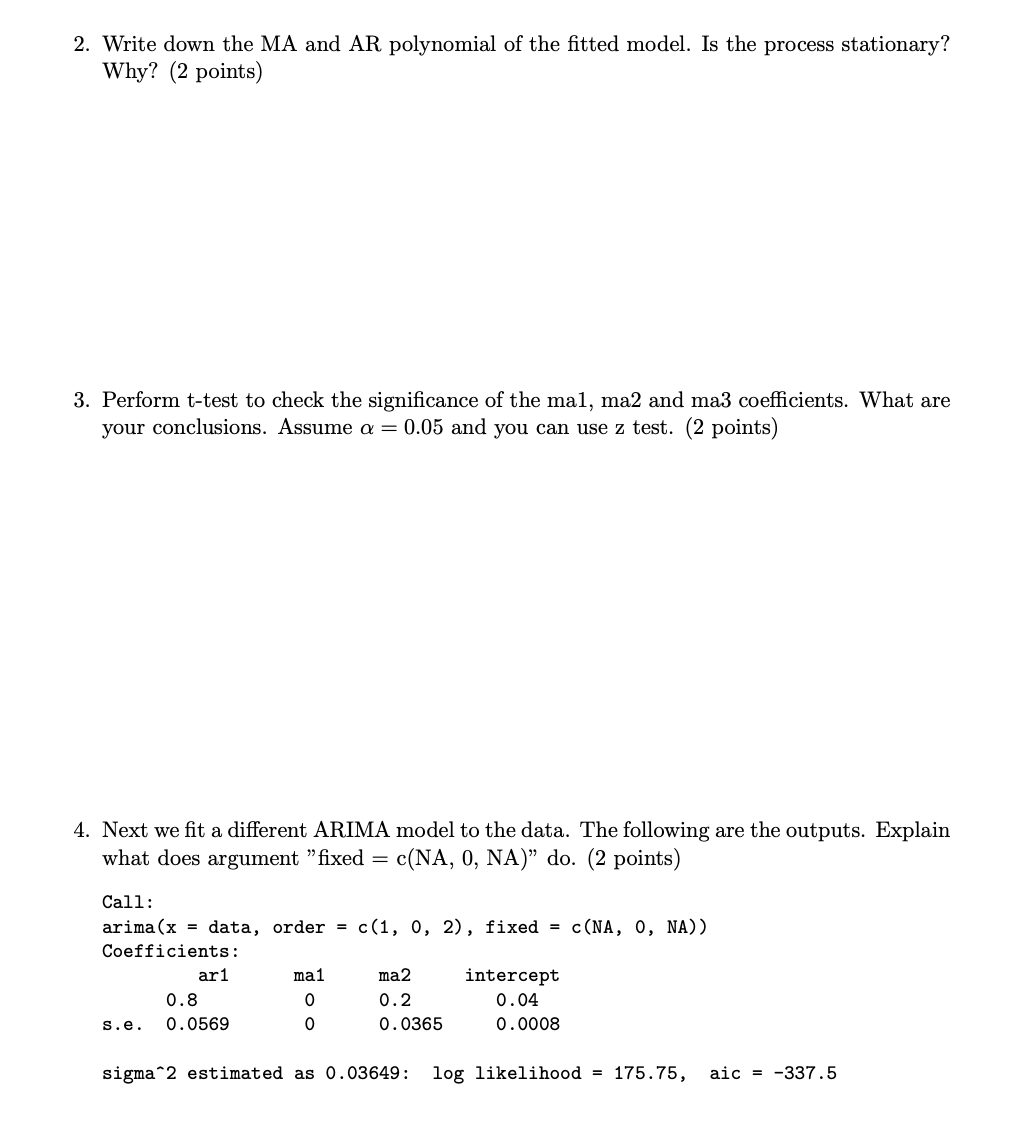
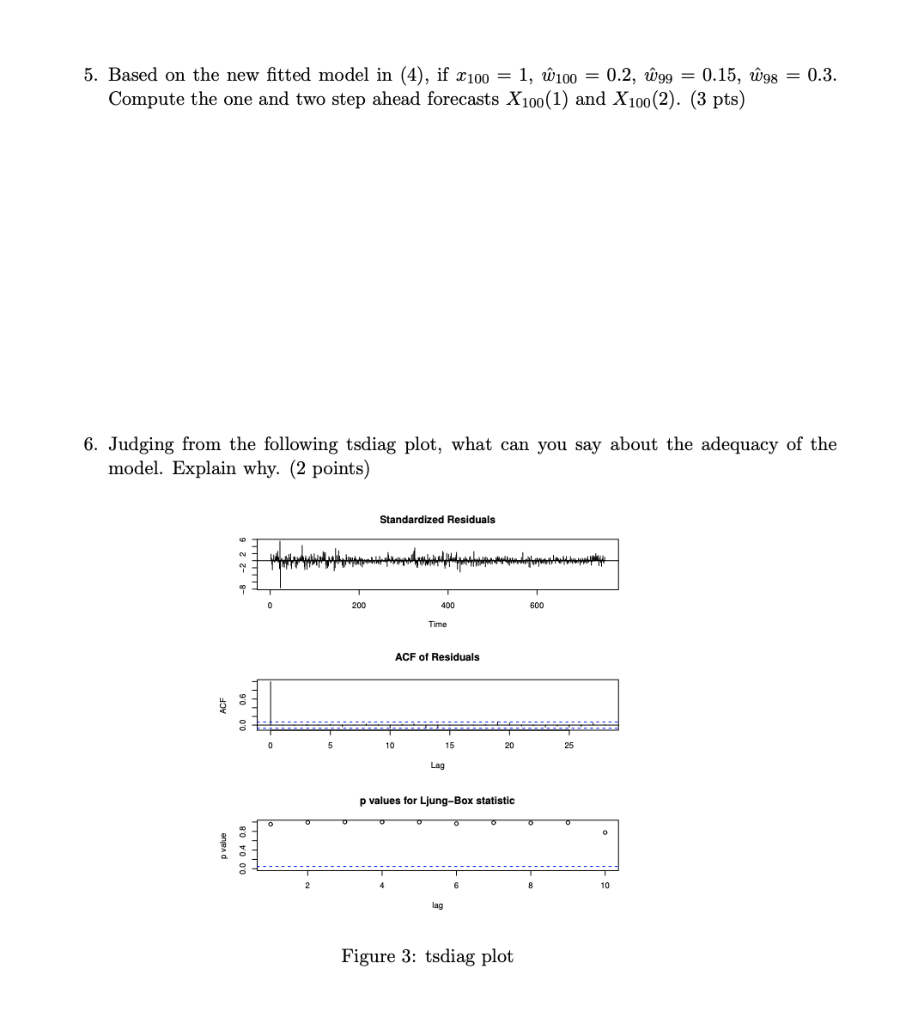
Problem D (13 points) In the following we apply the arima model to analyze a time series. 1. We fit an ARIMA (p, d, q) model to the data. Based on the following outputs, write down the fitted model. (2 points) Call: arima (x = data, order = c(1, 0, 3)) Coefficients: ar1 ma1 ma2 ma3 0.7301 -0.7468 0.2194 0.0073 s.e. 0.0686 0.7716 0.0462 0.0501 intercept 0.0396 0.0098 sigma2 estimated as 0.03643: log likelihood = 176.43, aic = -334.87 2. Write down the MA and AR polynomial of the fitted model. Is the process stationary? Why? (2 points) 3. Perform t-test to check the significance of the mal, ma2 and ma3 coefficients. What are your conclusions. Assume a = 0.05 and you can use z test. (2 points) 4. Next we fit a different ARIMA model to the data. The following are the outputs. Explain what does argument "fixed = c(NA, O, NA) do. (2 points) c(1, 0, 2), fixed = c(NA, O, NA)) Call: arima (x = data, order = Coefficients: ar1 ma1 0.8 0 s.e. 0.0569 0 ma2 0.2 0.0365 intercept 0.04 0.0008 sigma 2 estimated as 0.03649: log likelihood = 175.75, aic = -337.5 5. Based on the new fitted model in (4), if 2100 = 1, W100 = 0.2, W99 = 0.15, W98 = 0.3. Compute the one and two step ahead forecasts X 100(1) and X 100(2). (3 pts) 6. Judging from the following tsdiag plot, what can you say about the adequacy of the model. Explain why. (2 points) Standardized Residuals -3 -2 2 6 AM 0 200 400 600 Time ACF of Residuals 10 15 20 25 Lag p values for Ljung-Box statistic o Prade 0.0 04 0.8 10 Figure 3: tsdiag plot Problem D (13 points) In the following we apply the arima model to analyze a time series. 1. We fit an ARIMA (p, d, q) model to the data. Based on the following outputs, write down the fitted model. (2 points) Call: arima (x = data, order = c(1, 0, 3)) Coefficients: ar1 ma1 ma2 ma3 0.7301 -0.7468 0.2194 0.0073 s.e. 0.0686 0.7716 0.0462 0.0501 intercept 0.0396 0.0098 sigma2 estimated as 0.03643: log likelihood = 176.43, aic = -334.87 2. Write down the MA and AR polynomial of the fitted model. Is the process stationary? Why? (2 points) 3. Perform t-test to check the significance of the mal, ma2 and ma3 coefficients. What are your conclusions. Assume a = 0.05 and you can use z test. (2 points) 4. Next we fit a different ARIMA model to the data. The following are the outputs. Explain what does argument "fixed = c(NA, O, NA) do. (2 points) c(1, 0, 2), fixed = c(NA, O, NA)) Call: arima (x = data, order = Coefficients: ar1 ma1 0.8 0 s.e. 0.0569 0 ma2 0.2 0.0365 intercept 0.04 0.0008 sigma 2 estimated as 0.03649: log likelihood = 175.75, aic = -337.5 5. Based on the new fitted model in (4), if 2100 = 1, W100 = 0.2, W99 = 0.15, W98 = 0.3. Compute the one and two step ahead forecasts X 100(1) and X 100(2). (3 pts) 6. Judging from the following tsdiag plot, what can you say about the adequacy of the model. Explain why. (2 points) Standardized Residuals -3 -2 2 6 AM 0 200 400 600 Time ACF of Residuals 10 15 20 25 Lag p values for Ljung-Box statistic o Prade 0.0 04 0.8 10 Figure 3: tsdiag plot
Step by Step Solution
There are 3 Steps involved in it

Get step-by-step solutions from verified subject matter experts


