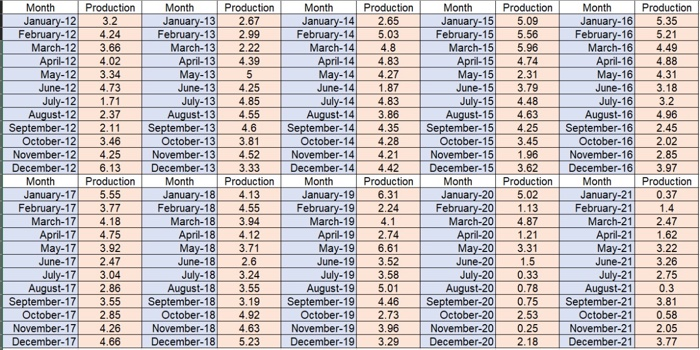
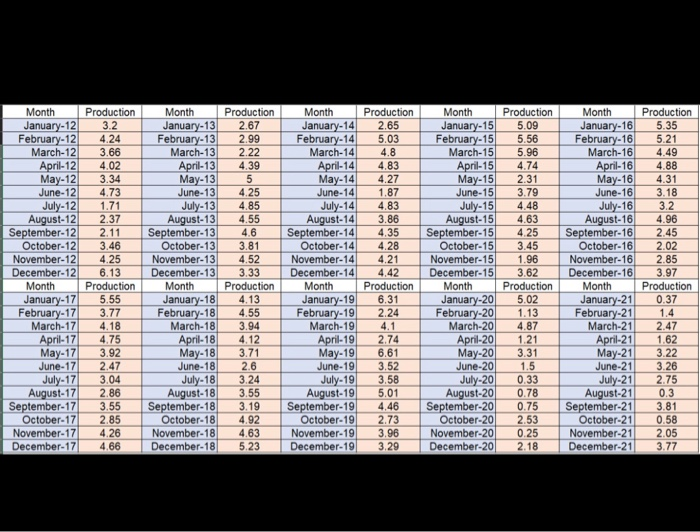
Problem No. 2: Lately, Greenophyll's produce division has been struggling with sales for two years now. The reason is that the overall monthly production has been lower than expected. They know that the production process is designed to yield an average of 4 tons per month, and this amount of sales is enough to keep them profitable. The company's experts claim that there is not a specific reason for the low production in the last two years, and they are confident that this is due to pure variation. If the company does not take action now, it will be forced to shut down the operations of its produce division in as soon as 12 months from now. The only solution they have to resolve this situation is very costly and they do not currently have enough funds to pay for it. However, if they can produce over 4 tons monthly for at least four of the months before the closure announcement deadline, the profits gained can cover the solution expenses. Otherwise, they will have to take a very expensive loan now, which the company is trying to avoid by any means possible. Being an inexperienced intern, you believed the claims put forth by the experts and you have an idea that could help the top management decide on which route they should take. You asked your supervisor at the company to provide you with the historical monthly production figures available in the company's archive (see sheet "Q2" in the attached Excel file). a) Explain your plan and choose the best option for the company in your opinion. Justify your decision (4 points) b) Do you think the opinion given by the experts seems to be correct? Explain using some of the tools you learned in class and revise your plan if needed. (4 points) Production 5.09 5.56 5.96 4.74 2.31 3.79 4.48 4.63 4.25 3.45 1.96 Month January-12 February-12 March-12 April-12 May-12 June-12 July-12 August-12 September-12 October-12 November-12 December-12 Month January-17 February-17 March-17 April-17 May-17 June-17 July-17 August-17 September-17 October-17 November-17 December-17 3.62 Production 3.2 4.24 3.66 4.02 3.34 4.73 1.71 2.37 2.11 3.46 4.25 6.13 Production 5.55 3.77 4.18 4.75 3.92 2.47 3.04 2.86 3.55 2.85 4.26 4.66 Month January-13 February-13 March-13 April-13 May-13 June-13 July-13 August-13 September-13 October-13 November-13 December-13 Month January-18 February-18 March-18 April-18 May-18 June-18 July-18 August-18 September-18 October-18 November-18 December-18 Production 2.67 2.99 2.22 4.39 5 4.25 4.85 4.55 4.6 3.81 4.52 3.33 Production 4.13 4.55 3.94 4.12 3.71 2.6 3.24 3.55 3.19 4.92 4.63 Month January-14 February-14 March-14 April-14 May-14 June-14 July-14 August-14 September-14 October-14 November 14 December-14 Month January-19 February-19 March-19 April-19 May-19 June-19 July-19 August 19 September-19 October-19 November 19 December 19 Production 2.65 5.03 4.8 4.83 4.27 1.87 4.83 3.86 4.35 4.28 4.21 4.42 Production 6.31 2.24 4.1 2.74 6.61 3.52 3.58 5.01 4.46 2.73 3.96 3.29 Month January-15 February-15 March-15 April-15 May-15 June-15 July-15 August-15 September-15 October-15 November-15 December-15 Month January-20 February-20 March-20 April-20 May-20 June-20 July-20 August-20 September-20 October-20 November-20 December-20 Month January-16 February-16 March-16 April-16 May-16 June-16 July-16 August-16 September-16 October-16 November-16 December-16 Month January-21 February-21 March-21 April-21 May-21 June-21 July-21 August-21 September-21 October-21 November-21 December-21 Production 5.35 5.21 4.49 4.88 4.31 3.18 3.2 4.96 2.45 2.02 2.85 3.97 Production 0.37 1.4 2.47 1.62 3.22 3.26 2.75 0.3 3.81 0.58 2.05 3.77 Production 5.02 1.13 4.87 1.21 3.31 1.5 0.33 0.78 0.75 2.53 0.25 2.18 5.23 Month January-12 February-12 March-12 April-12 May-12 June-12 July-12 August-12 September-12 October 12 November-12 December-12 Month January-17 February-17 March-17 April-17 May-17 June-17 July-17 August-17 September-17 October 17 November-17 December-17 Production 3.2 4.24 3.66 4.02 3.34 4.73 1.71 2.37 2.11 3.46 4.25 6.13 Production 5.55 3.77 4.18 4.75 3.92 2.47 3.04 2.86 3.55 2.85 4.26 4.66 Month January-13 February-13 March-13 April-13 May-13 June-13 July-13 August-13 September-13 October-13 November-13 December-13 Month January-18 February-18 March-18 April-18 May-18 June-18 July-18 August-18 September-18 October-18 November-18 December-18 Production 2.67 2.99 2.22 4.39 5 4.25 4.85 4.55 4.6 3.81 4.52 3.33 Production 4.13 4.55 3.94 4.12 3.71 2.6 3.24 3.55 3.19 4.92 4.63 5.23 Month January-14 February-14 March-14 April-14 May-14 June-14 July-14 August-14 September-14 October 14 November-14 December-14 Month January-19 February-19 March-19 April-19 May-19 June-19 July-19 August 19 September-19 October-19 November 19 December-19 Production 2.65 5.03 4.8 4.83 4.27 1.87 4.83 3.86 4.35 4.28 4.21 4.42 Production 6.31 2.24 4.1 2.74 6.61 3.52 3.58 5.01 4.46 2.73 3.96 3.29 Month January-15 February-15 March-15 April-15 May-15 June-15 July-15 August-15 September-15 October-15 November-15 December 15 Month January-20 February-20 March-20 April-20 May-20 June-20 July-20 August-20 September-20 October-20 November-20 December-20 Production 5.09 5.56 5.96 4.74 2.31 3.79 4.48 4.63 4.25 3.45 1.96 3.62 Production 5.02 1.13 4.87 1.21 3.31 1.5 0.33 0.78 0.75 2.53 0.25 2.18 Month January-16 February-16 March-16 April-16 May-16 June-16 July-16 August-16 September-16 October-16 November-16 December-16 Month January-21 February-21 March-21 April-21 May-21 June-21 July-21 August-21 September-21 October-21 November-21 December-21 Production 5.35 5.21 4.49 4.88 4.31 3.18 3.2 4.96 2.45 2.02 2.85 3.97 Production 0.37 1.4 2.47 1.62 3.22 3.26 2.75 0.3 3.81 0.58 2.05 3.77


