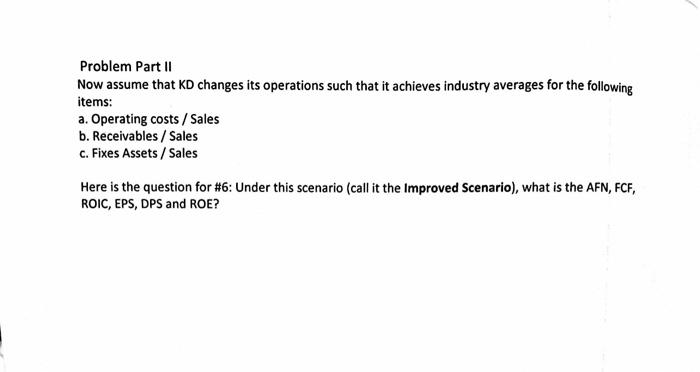
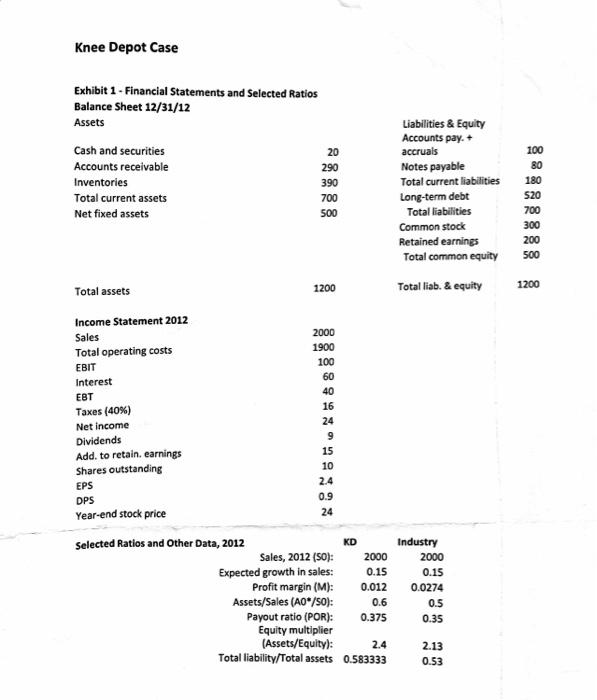
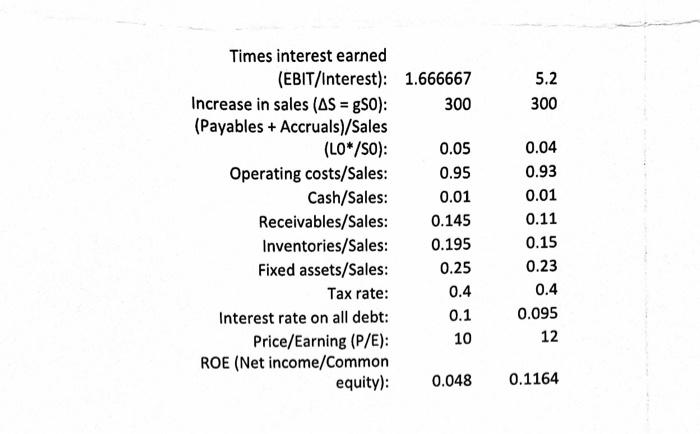
Problem Part II Now assume that KD changes its operations such that it achieves industry averages for the following items: a. Operating costs / Sales b. Receivables / Sales c. Fixes Assets / Sales Here is the question for #6: Under this scenario (call it the Improved Scenario), what is the AFN, FCF, ROIC, EPS, DPS and ROE? Knee Depot Case Exhibit 1 - Financial Statements and Selected Ratios Balance Sheet 12/31/12 Assets Cash and securities 20 100 Accounts receivable 290 80 390 180 Inventories Total current assets Liabilities & Equity Accounts pay. + accruals Notes payable Total current liabilities Long-term debt Total liabilities Common stock Retained earnings Total common equity 700 520 Net fixed assets 500 700 300 200 500 1200 Total liab. & equity 1200 Total assets 2000 1900 100 60 40 Income Statement 2012 Sales Total operating costs EBIT Interest EBT Taxes (40%) Net income Dividends Add to retain earnings Shares outstanding EPS 16 24 9 15 10 2.4 0.9 DPS Year-end stock price 24 Selected Ratios and Other Data, 2012 KD Sales, 2012 (50): 2000 Expected growth in sales: 0.15 Profit margin (M): 0.012 Assets/Sales (AO*/50): 0.6 Payout ratio (POR): 0.375 Equity multiplier (Assets/Equity): 2.4 Total liability/Total assets 0.583333 Industry 2000 0.15 0.0274 0.5 0.35 2.13 0.53 5.2 300 0.04 0.93 0.01 Times interest earned (EBIT/Interest): 1.666667 Increase in sales (AS = g50): 300 (Payables + Accruals)/Sales (LO*/SO): 0.05 Operating costs/Sales: 0.95 Cash/Sales: 0.01 Receivables/Sales: 0.145 Inventories/Sales: 0.195 Fixed assets/Sales: 0.25 Tax rate: 0.4 Interest rate on all debt: 0.1 Price/Earning (P/E): 10 ROE (Net income/Common equity): 0.048 0.11 0.15 0.23 0.4 0.095 12 0.1164 Problem Part II Now assume that KD changes its operations such that it achieves industry averages for the following items: a. Operating costs / Sales b. Receivables / Sales c. Fixes Assets / Sales Here is the question for #6: Under this scenario (call it the Improved Scenario), what is the AFN, FCF, ROIC, EPS, DPS and ROE? Knee Depot Case Exhibit 1 - Financial Statements and Selected Ratios Balance Sheet 12/31/12 Assets Cash and securities 20 100 Accounts receivable 290 80 390 180 Inventories Total current assets Liabilities & Equity Accounts pay. + accruals Notes payable Total current liabilities Long-term debt Total liabilities Common stock Retained earnings Total common equity 700 520 Net fixed assets 500 700 300 200 500 1200 Total liab. & equity 1200 Total assets 2000 1900 100 60 40 Income Statement 2012 Sales Total operating costs EBIT Interest EBT Taxes (40%) Net income Dividends Add to retain earnings Shares outstanding EPS 16 24 9 15 10 2.4 0.9 DPS Year-end stock price 24 Selected Ratios and Other Data, 2012 KD Sales, 2012 (50): 2000 Expected growth in sales: 0.15 Profit margin (M): 0.012 Assets/Sales (AO*/50): 0.6 Payout ratio (POR): 0.375 Equity multiplier (Assets/Equity): 2.4 Total liability/Total assets 0.583333 Industry 2000 0.15 0.0274 0.5 0.35 2.13 0.53 5.2 300 0.04 0.93 0.01 Times interest earned (EBIT/Interest): 1.666667 Increase in sales (AS = g50): 300 (Payables + Accruals)/Sales (LO*/SO): 0.05 Operating costs/Sales: 0.95 Cash/Sales: 0.01 Receivables/Sales: 0.145 Inventories/Sales: 0.195 Fixed assets/Sales: 0.25 Tax rate: 0.4 Interest rate on all debt: 0.1 Price/Earning (P/E): 10 ROE (Net income/Common equity): 0.048 0.11 0.15 0.23 0.4 0.095 12 0.1164


