Answered step by step
Verified Expert Solution
Link Copied!

Question

1 Approved Answer

Problem: The data shown are the scores of 30 students in Statistics Exam. Construct a FDT with 9 as the class intervals. 65 81 65

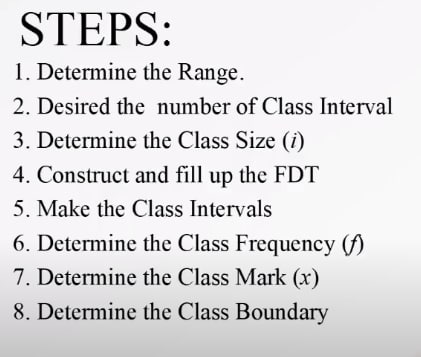
image text in transcribedimage text in transcribed
Problem: The data shown are the scores of 30 students in Statistics Exam. Construct a FDT with 9 as the class intervals. 65 81 65 68 55 47 69 61 75 71 67 56 61 87 50 74 49 66 77 75 85 49 89 79 68 90 57 63 54 90STEPS: 1. Determine the Range. 2. Desired the number of Class Interval 3. Determine the Class Size (i) 4. Construct and fill up the FDT 5. Make the Class Intervals 6. Determine the Class Frequency (f) 7. Determine the Class Mark (x) 8. Determine the Class Boundary

Step by Step Solution

There are 3 Steps involved in it

Step: 1

blur-text-image

Get Instant Access to Expert-Tailored Solutions

See step-by-step solutions with expert insights and AI powered tools for academic success

Step: 2

blur-text-image

Step: 3

blur-text-image

Ace Your Homework with AI

Get the answers you need in no time with our AI-driven, step-by-step assistance

Get Started

Recommended Textbook for

Calculus An Applied Approach

Authors: Ron Larson, Dennis J McKenzie, Larson/Edwards, Bruce H Edwards

7th Edition

1111809720, 9781111809720

More Books

Students also viewed these Mathematics questions