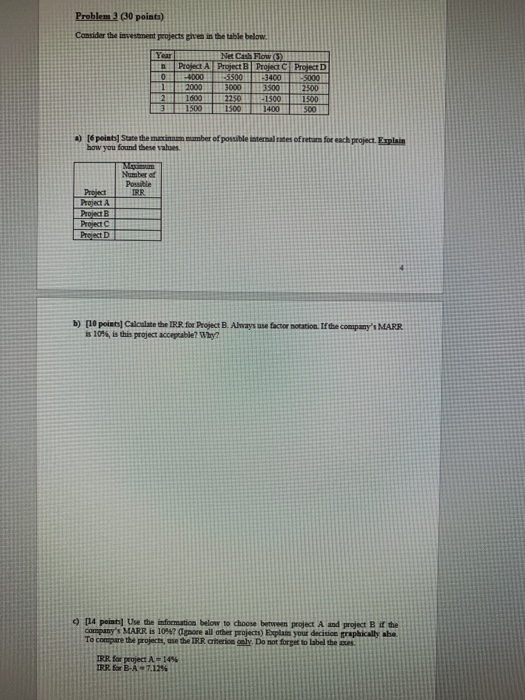
Problem2 (30 points) Consider the investment projects pren in the table below. Year 0 1 2 3 Net Cash Flow 5) Project A Project Project Project 4000 -5500 3400 5000 2000 3000 3500 2500 1600 2250 -1500 1500 1500 1500 1400 500 a) (6 points Suate the maximum munber of possible internal rates of return for each project. Explain how you found these values Number of Possible IRR Project Project A Project B Project Project b) [10 points Calculate the IRR for Project B. Always use factor notation. If the company's MARR is 10%, is this project acceptable? Why? 9 14 points Use the information below to choose between project A and project B if the company's MARR is 10% ore all other projects) Explain your decision graphically the To compare the projects, as the IRR arerio cely. Do not forget to label the ces IRR for project A-14% IRR Box B- A7.12% Year 9 10 11 0.7589 1.0619 3.636 0,4554 3.636 3.636 TABLE 9.9 MACRS Percentages for Real Property Month Property sped in Service 1 2 3 4 5 17 8 (a) Residential Rental Property: Straight-Line over 27.5 Years Midmonth Convention 3.4858 3.1824 2.8799 2.5764 212739 1.9705 1.6679 1.364% 249 3.636 3.636 3.636 3.636 3.636 3.636 3.636 3.636 10 3.637 3.637 3.637 3.637 3.637 3.637 3.636 3.636 11 3.636 3.636 3.636 3.636 3.636 3.636 3.637 3.637 12 3.637 3.637 3.637 3.637 3.637 3.637 3.636 3.636 13 3.636 3.636 3.636 3.636 3.636 3.636 3,637 3.637 14-25 3.637 3.637 3.637 3.637 3.637 3.637 3.636 3.636 26 3.637 3.637 3.637 3.637 3.637 3.637 3.636 3.636 27 3.636 3.636 3.636 3.636 3.636 3.636 3.637 3.637 28 197 2.273 2.576 2.879 3.182 5,485 3.636 3636 3,636 3.636 3.636 3.637 3.637 3,637 3.636 3.636 3.636 3.637 3.637 3.637 3.636 3.636 3.636 3.636 3.636 3.636 3.637 31637 3.637 3.636 3.636 3.636 0.758 3.636 3.636 29 0.152 0.455 (b) Nonresidential Real Property: Straight-Line Over 39 Years with Midmonth Convention 2.4573 2.2436 2.0299 1.8162 1.6026 1.3889 1.1752 0.9615 2-39 25641 2.5641 2.5641 2.5641 2.5641 2.5641 2.5641 2.5641 40 0.1068 0.3205 0.5342 0.7479 0.9615 1.1752 1.3889 1.6026 0.7479 0.5342 0.3205 215641 215641 215641 1.8162 2.0299 202236 E-posta Yaz AS Cash Flow Diagram TABLE 3.6 Summary of Discrete Compounding Formulas with Discrete Payments Factor Flow Type Notation Exel Caminan S Compand F-PII + 1 1 -FV(1.N.O.P) N I EXPLN) G Present 1 P-F(1 + 0) -PV(1.N.O.F) E PLN) E Compound amount F-A PU(1,N,A) (FYA..M A L N 01 23 N-1 IN AAAAA -PNT(1,N.0,P) P Y M Sinking Find TAUFIN) A- N T Present worth (P/A, IN) (1 +1) PA -PV(1,N.A) 1 2 3 N-IN S E R 1 E S Capital recovery IVP... N) A- (1+i)n -PNTYI. NP) G Linear gradient A D INIKO P- )-IN - Fil+ o) E N T Present worth (PAG, M Equal-payment Conversion fictor (AGM) 211 1 G *(1 + 1) - IN- (+)-1) 123 N-IN VP S E R Geometric gradient - {1+ A: i- *****] P E Present worth (P/A.K.I.N) N 201 TABLE 9.6 MACRS Depreciation Schedules for Personal Properties with Half-Year Convention, Declining-Balance Method Class 3 5 7 10 15 20 Year Depreciation Rate 200% 200% 200% 200% 150% 150% 1 33.33 20.00 14.29 10.00 5.00 3.750 2 44.45 32.00 24.49 18.00 9.50 7.219 3 14.81* 19.20 17.49 14.40 8.55 6.677 4 7.41 11.52* 12.49 11.52 7.70 6.177 5 11.52 8.93 9.22 6.93 5.713 6 5.76 8.92 7.37 6.23 5.285 7 8.93 6.55* 5.90 4.888 8 4.46 6.55 5.90 4.522 9 6.56 5.91 4.462 10 6.55 5.90 4.461 3.28 5.91 4.462