

Answered step by step
Verified Expert Solution
Question
1 Approved Answer
Problem#2-(3.0 POINTS) - Chapter 4 -Regression Models - MODIFIED Triple A Construction Company example presented on pages 112-122. The figures for Triple A's revenue and
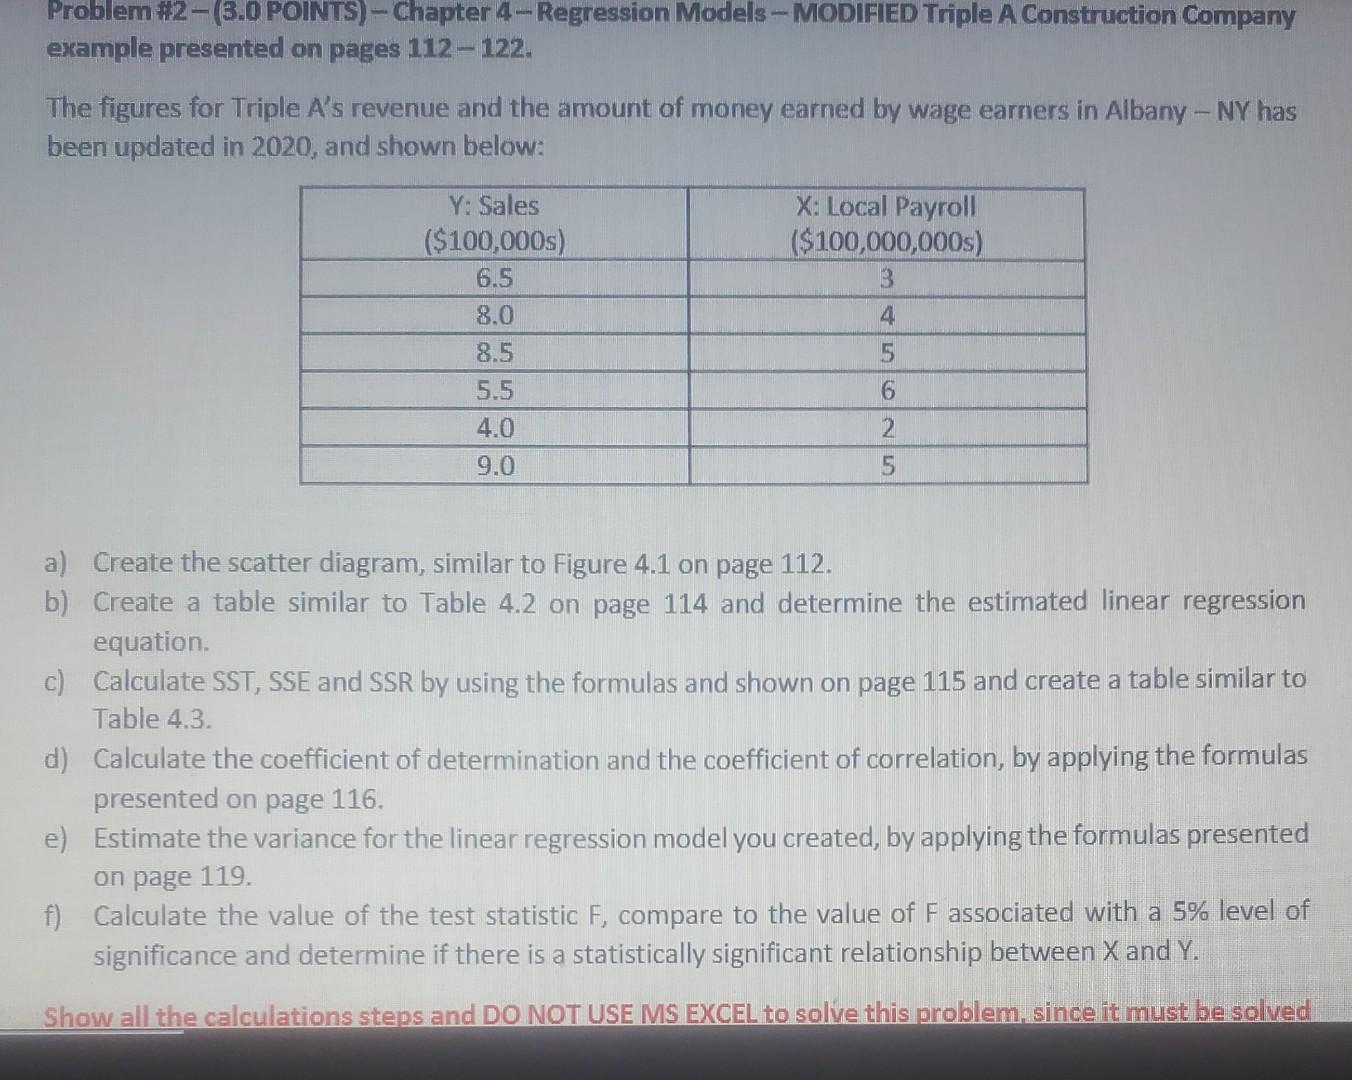
Problem#2-(3.0 POINTS) - Chapter 4 -Regression Models - MODIFIED Triple A Construction Company example presented on pages 112-122. The figures for Triple A's revenue and the amount of money earned by wage earners in Albany - NY has been updated in 2020, and shown below: X: Local Payroll ($100,000,000s) 3 4 Y: Sales ($100,000s) 6.5 8.0 8.5 5.5 4.0 9.0 5 6 2 5 a) Create the scatter diagram, similar to Figure 4.1 on page 112. b) Create a table similar to Table 4.2 on page 114 and determine the estimated linear regression equation c) Calculate SST, SSE and SSR by using the formulas and shown on page 115 and create a table similar to Table 4.3. d) Calculate the coefficient of determination and the coefficient of correlation, by applying the formulas presented on page 116. e) Estimate the variance for the linear regression model you created, by applying the formulas presented on page 119. f) Calculate the value of the test statistic F, compare to the value of F associated with a 5% level of significance and determine if there is a statistically significant relationship between X and Y. Show all the calculations steps and DO NOT USE MS EXCEL to solve this problem since it must be solved Problem#2-(3.0 POINTS) - Chapter 4 -Regression Models - MODIFIED Triple A Construction Company example presented on pages 112-122. The figures for Triple A's revenue and the amount of money earned by wage earners in Albany - NY has been updated in 2020, and shown below: X: Local Payroll ($100,000,000s) 3 4 Y: Sales ($100,000s) 6.5 8.0 8.5 5.5 4.0 9.0 5 6 2 5 a) Create the scatter diagram, similar to Figure 4.1 on page 112. b) Create a table similar to Table 4.2 on page 114 and determine the estimated linear regression equation c) Calculate SST, SSE and SSR by using the formulas and shown on page 115 and create a table similar to Table 4.3. d) Calculate the coefficient of determination and the coefficient of correlation, by applying the formulas presented on page 116. e) Estimate the variance for the linear regression model you created, by applying the formulas presented on page 119. f) Calculate the value of the test statistic F, compare to the value of F associated with a 5% level of significance and determine if there is a statistically significant relationship between X and Y. Show all the calculations steps and DO NOT USE MS EXCEL to solve this problem since it must be solved
Step by Step Solution
There are 3 Steps involved in it
Step: 1

Get Instant Access to Expert-Tailored Solutions
See step-by-step solutions with expert insights and AI powered tools for academic success
Step: 2

Step: 3
Ace Your Homework with AI
Get the answers you need in no time with our AI-driven, step-by-step assistance
Get Started
Labour Finance And Inequality
Authors: Suzanne J. Konzelmann, Simon Deakin, Marc Fovargue-Davies, Frank Wilkinson
1st Edition
1138919721, 978-1138919723