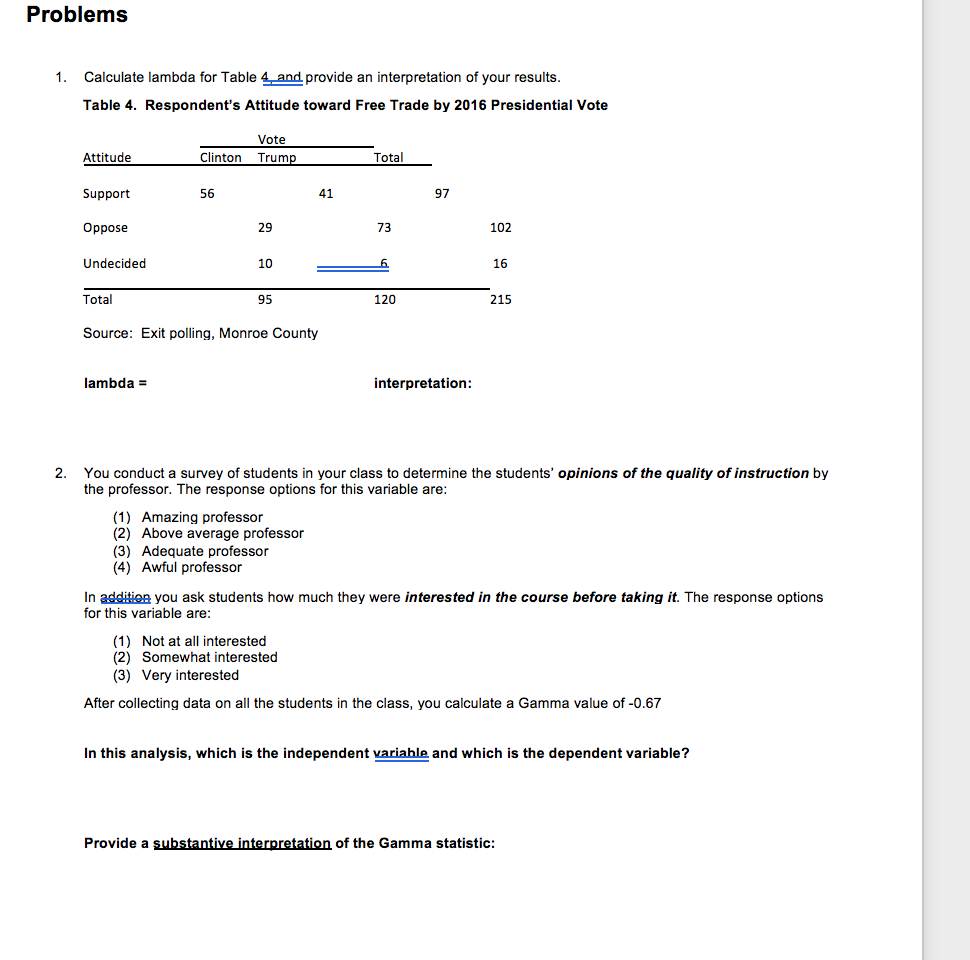
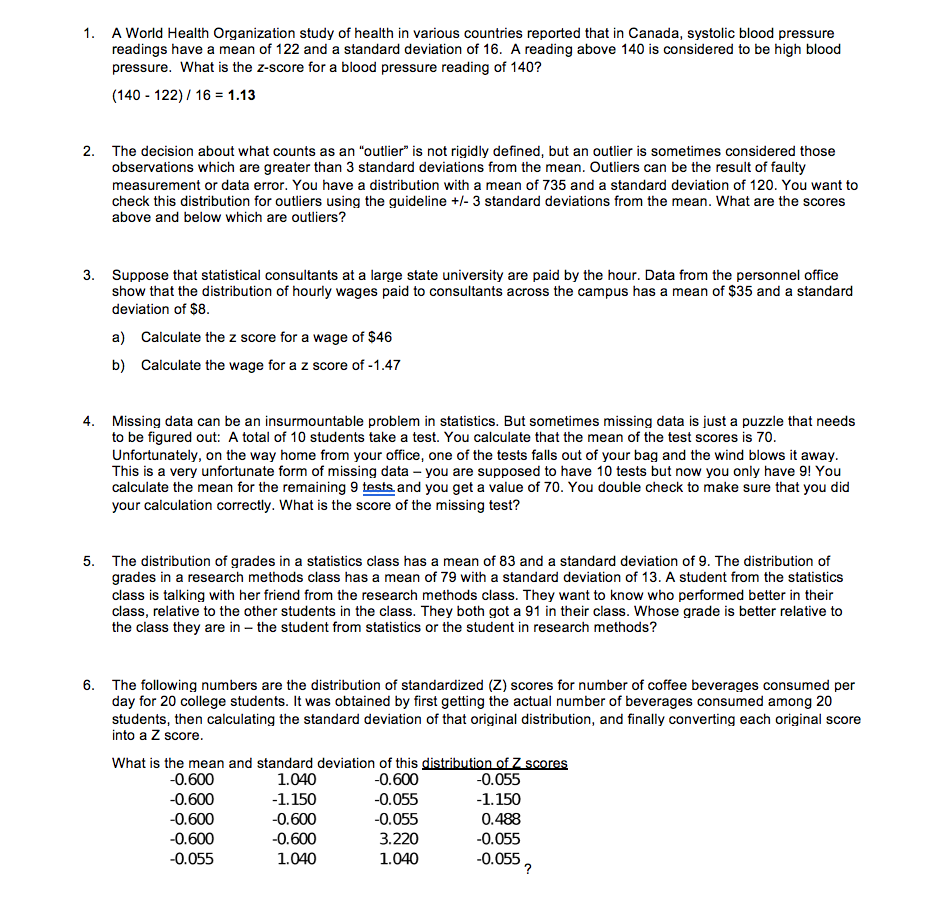
Problems 1. Calculate lambda for Table 4 and provide an interpretation of your results. Table 4. Respondent's Attitude toward Free Trade by 2016 Presidential Vote Vote Attitude Clinton Trump Total Support 56 41 97 Oppose 29 73 102 Undecided 10 6 16 Total 95 120 215 Source: Exit polling, Monroe County lambda = interpretation: 2. You conduct a survey of students in your class to determine the students' opinions of the quality of instruction by the professor. The response options for this variable are: (1) Amazing professor (2) Above average professor (3) Adequate professor 4) Awful professor In addition you ask students how much they were interested in the course before taking it. The response options for this variable are. (1) Not at all interested 2) Somewhat interested 3) Very interested After collecting data on all the students in the class, you calculate a Gamma value of -0.67 In this analysis, which is the independent variable and which is the dependent variable? Provide a substantive interpretation of the Gamma statistic:A World Health Organization study of health in various countries reported that in Canada, systolic blood pressure readings have a mean of 122 and a standard deviation of 16. A reading above 140 is considered to be high blood pressure. What is the z-score for a blood pressure reading of 140? (140 - 122)i16 =1.13 The decision about what counts as an \"outlier\" is not rigidly dened, but an outlier is sometimes considered those observations which are greater than 3 standard deviations from the mean. Outliers can be the result of faulty measurement or data error. You have a distribution with a mean of F35 and a standard deviation of 120. You want to check this distribution for outliers using the guideline +i- 3 standard deviations from the mean. What are the scores above and below which are outliers? Suppose that statistical consultants at a large state university are paid by the hour. Data from the personnel ofce show that the distribution of houny wages paid to consultants across the campus has a mean of $35 and a standard deviation of $8. a) Calculate the z score for a wage of 548 b} Calculate the wage for a z score of -1 .47 Missing data can be an insurmountable problem in statistics. But sometimes missing data is just a puzzle that needs to be gured out: A total of 10 students take a test. You calculate that the mean of the test scores is TU. Unfortunately. on the way home from your ofce, one of the tests falls out of your bag and the wind blows it away. This is a very unfortunate form of missing data you are supposed to have 10 tests but now you only have 9! You calculate the mean for the remaining 9 gand you get a value of To. You double check to make sure that you did your calculation correctly. What is the score of the missing test? The distribution of grades in a statistics class has a mean of 83 and a standard deviation of Q. The distribution of grades in a research methods class has a mean of 79 with a standard deviation of 13. A student from the statistics class is talking with her friend from the research methods class. They want to know who performed better in their class. relative to the other students in the class. They both got a 91 in their class. Whose grade is better relative to the class they are in - the student from statistics or the student in research methods? The following numbers are the distribution of standardized (2) scores for number of coffee beverages consumed per day for 20 college students. It was obtained by rst getting the actual number of beverages consumed among 20 stu dents, then calculating the standard deviation of that original distribution, and finally converting each original score into a 2 score. What is the mean and standard deviation of this mm 0.600 1.040 0.60} 0.055 0.600 l.]50 0.055 1. 150 0.600 0.600 0.055 0.48 0.600 0.600 3.220 0.055 0.055 1.040 1.040 0.055 7