Answered step by step
Verified Expert Solution
Link Copied!

Question

1 Approved Answer

PROBLEMS PI-19, Analyzing Home Depot (LG 4, 5) Home Depot, Inc, is a leading home improvement store. Listed below are comparative balance sheets and income
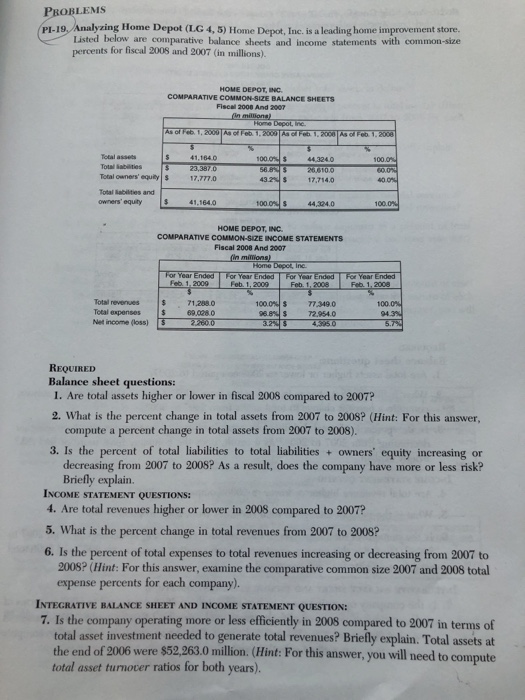
image text in transcribed
PROBLEMS PI-19, Analyzing Home Depot (LG 4, 5) Home Depot, Inc, is a leading home improvement store. Listed below are comparative balance sheets and income statements with common-size percents for fiscal 2008 and 2007 (in millions). HOME DEPOT, INC COMPARATIVE COMMON-SIZE BALANCE SHEETs Fiscal 2008 And 2007 ome Depot, inc. S 44 324.0 Total owners' equty 17,777.0 17,714.0 Total labilities and owners' equity 41,164.0 1000% 44.324.0 HOME DEPOT, INC. COMPARATIVE COMMON-SIZE INCOME STATEMENTS Fiscal 2008 And 20017 For Year Ended For Year Ended For Year Ended For Year Ended Feb. 1 Totail revenues71,288o Total expenses $ 69.008 Net income (loss) 100.0 3 26,8%|$ $ 77.349.0 72954.0 REQUIRED Balance sheet questions: 1. Are total assets higher or lower in fiscal 2008 compared to 2007? 2. What is the percent change in total assets from 2007 to 2008? (Hint: For this answer, compute a percent change in total assets from 2007 to 2008). 3. Is the percent of total liabilities to total liabilities owners' equity increasing or decreasing from 2007 to 200S? As a result, does the company have more or less risk? Briefly explain. INCOME STATEMENT QUESTIONS: 4. Are total revenues higher or lower in 2008 compared to 2007? 5. What is the percent change in total revenues from 2007 to 2008? 6. Is the percent of total expenses to total revenues increasing or decreasing from 2007 to 200S? (Hint: For this answer, examine the comparative common size 2007 and 2008 total expense percents for each company). INTEGRATIVE BALANCE SHEET AND INCOME STATEMENT QUESTION: 7. Is the company operating more or less efficiently in 2008 compared to 2007 in terms of total asset investment needed to generate total revenues? Briefly explain. Total assets at the end of 2006 were $52,263.0 million. (Hint: For this answer, you will need to compute total asset turnover ratios for both years)

Step by Step Solution

There are 3 Steps involved in it

Step: 1

blur-text-image

Get Instant Access to Expert-Tailored Solutions

See step-by-step solutions with expert insights and AI powered tools for academic success

Step: 2

blur-text-image_2

Step: 3

blur-text-image_3

Ace Your Homework with AI

Get the answers you need in no time with our AI-driven, step-by-step assistance

Get Started

Recommended Textbook for

Worship Audit Making Good Worship Better

Authors: Mark Earcy

1st Edition

1851742948, 978-1851742943

More Books

Students also viewed these Accounting questions