Answered step by step
Verified Expert Solution
Link Copied!

Question

1 Approved Answer

PROBSTATS1 1. For Each Claim below, write: (1) claim in mathematical form; (2) Null hypothesis (Ho); (3) alternative hypothesis (H,); (4) what tailed test. Use

PROBSTATS1

1. For Each Claim below, write: (1) claim in mathematical form; (2) Null hypothesis (Ho); (3) alternative hypothesis (H,); (4) what tailed test. Use notations Hi. Hz (for mean), P-Pz (for proportion), .02 (Sor standard deviation), Fo (for differences in means for dependent (Le, matched pair) samples) (10

(a) Claim: Califormia HS students on an average score lower in the SAT than Massachusetts HS students (1-Califomia, 2- Massachusets)

(b) Claim: The proportion of smokers in Texas is the same as that in Oklahoma (1- Texas, 2- Oklahoma)

(c) Claim: The standard deviation of weights in 8 oz Coke cans is at least as high as that in Pepsi cans (1- Coke, 2- Pepsi)

(d) Claim: Ethiopian track athletes are, on an average, faster long-distance runners than the USA track athletes (1 Ethiopia, 2- USA)

(e) Claim: The cholesterol level before taking Lipitor is, on an average, higher than that after taking the drug (1-Before drug. 2-Afer drug).

2. Average Temperatures The average temperatures for a 25-day period for Birmingham, Alabama, and Chicago, Illinois, are shown. Based on the samples, at a =0.10, can it be concluded that it is warmer in Birmingham?

Birmingham 78 82 68 67 68 75 73 75 64 68 62 73 77 78 79 74 72 73 78 68 73 79 82 71 66.

Chicage 70 74 73 60 77 71 72 71 74 76 71 80 65 70 83 67 76 7s 62 65 66 65 77 66 64.

3 Gambling A survey of 60 men found that 36 gamble. Another survey of 50 women found that 28 gamble. At a-0.01, is there a difference in the proportions?

4. Testing After Review A statistics class was given a pretest on probability (since many had previous experience in some other class). Then the class was given a six-page review handout to study for 2 days. At the next class they were given another test. Is there sufficient evidence that the scores improved? Use a-0.05.

students 1 2 3 4 5 6

pretest 52 50 40 58 60 52

Past test 62 65 50 65 68 63

5. For the problem below: a. Draw the scatter plot. b. Compute the value of the correlation coefficient. c. Test the significance of the correlation coefficient at a-0.01, using the shortcut method that you learned from the PowerPoint slides d. Determine the regression line equation if r is significant. e. Plot the regression line on the scatter plot, if appropriate. f. Predict y' for a specific value of x, if appropriate. Protein and Diastolic Blood Pressure A study was conducted with vegetarians to see whether the number of grams of protein each ate per day was related to diastolic blood pressure. The data are given here. If there is a significant relationship, predict the diastolic pressure of a vegetarian who consumes 8 grams of protein per day.

Grams x 4 6.5 5 5.5 8 10 9 8.2 10.5

pressure y 73 79 83 82 84 92 88 86 95

PART 2:
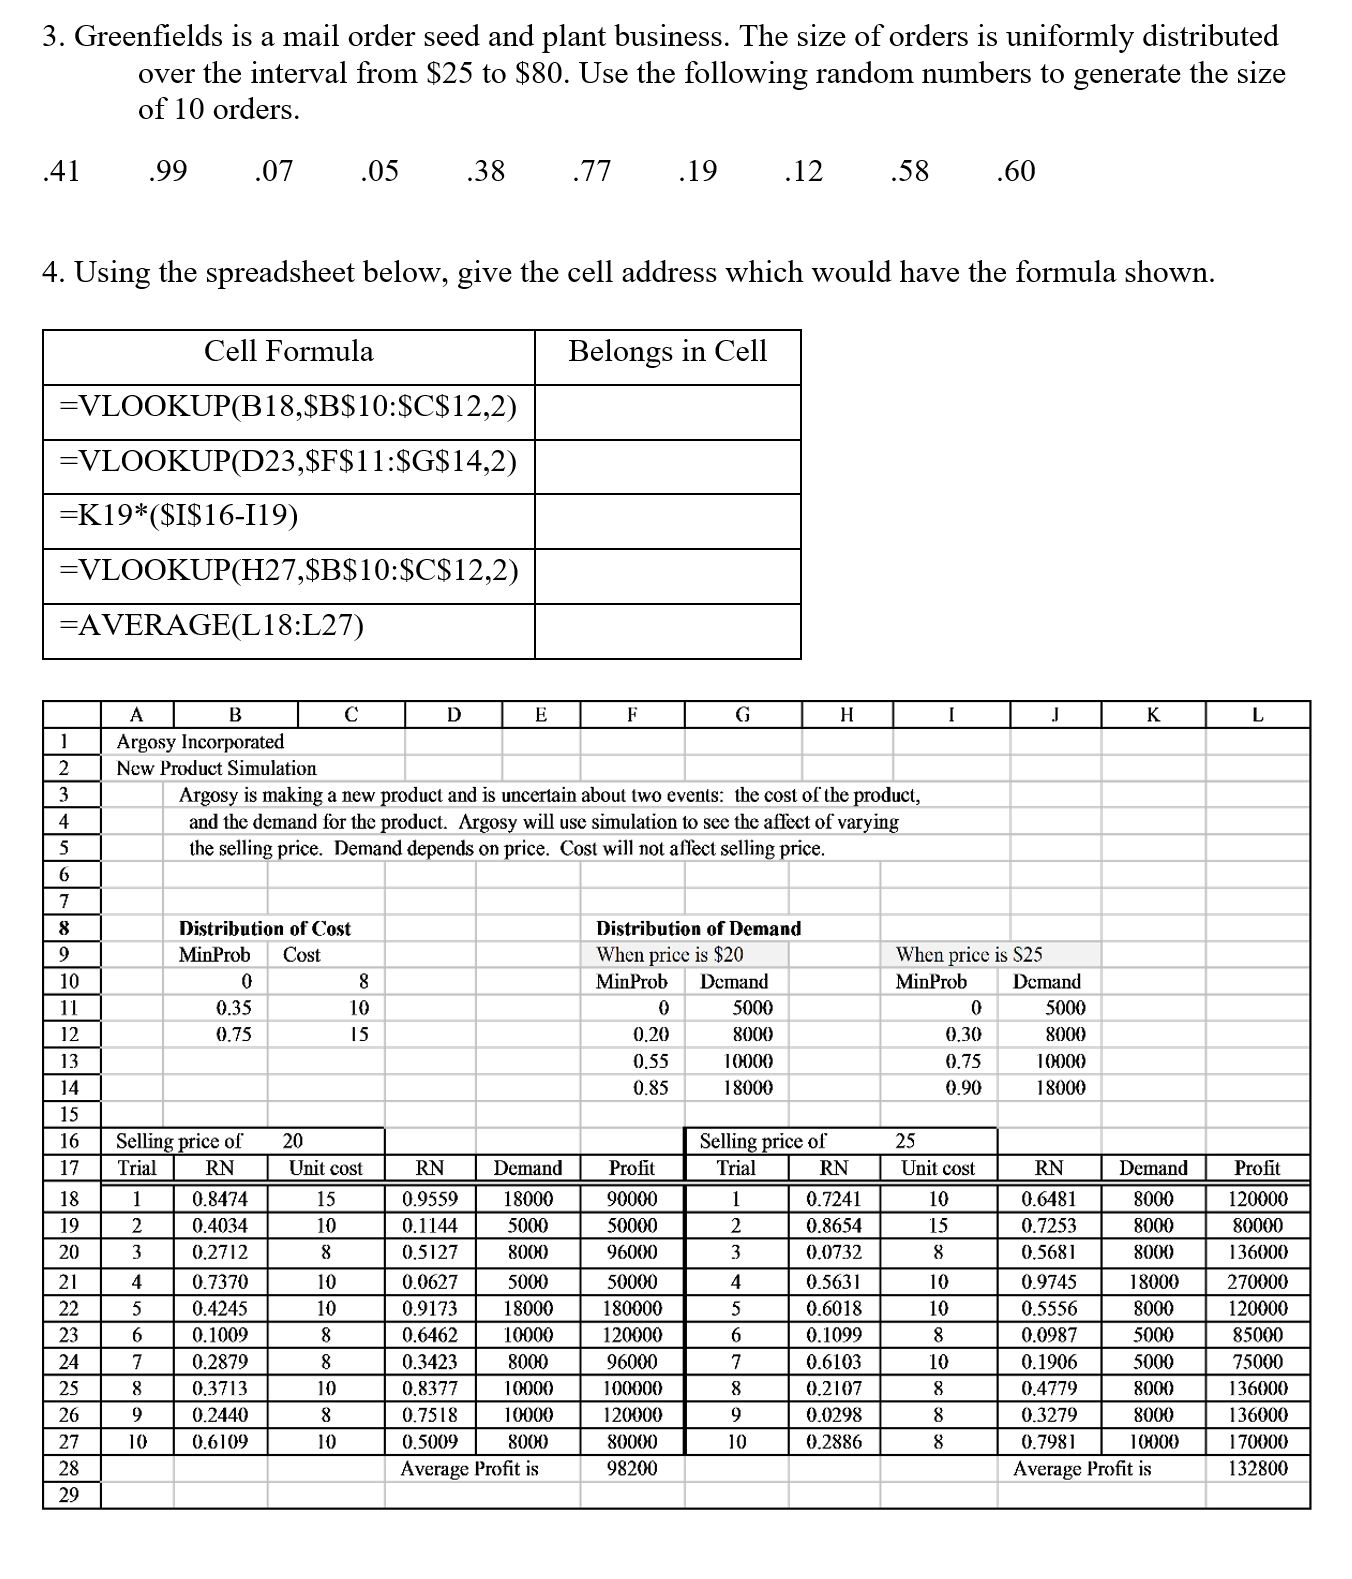
image text in transcribedimage text in transcribedimage text in transcribedimage text in transcribed
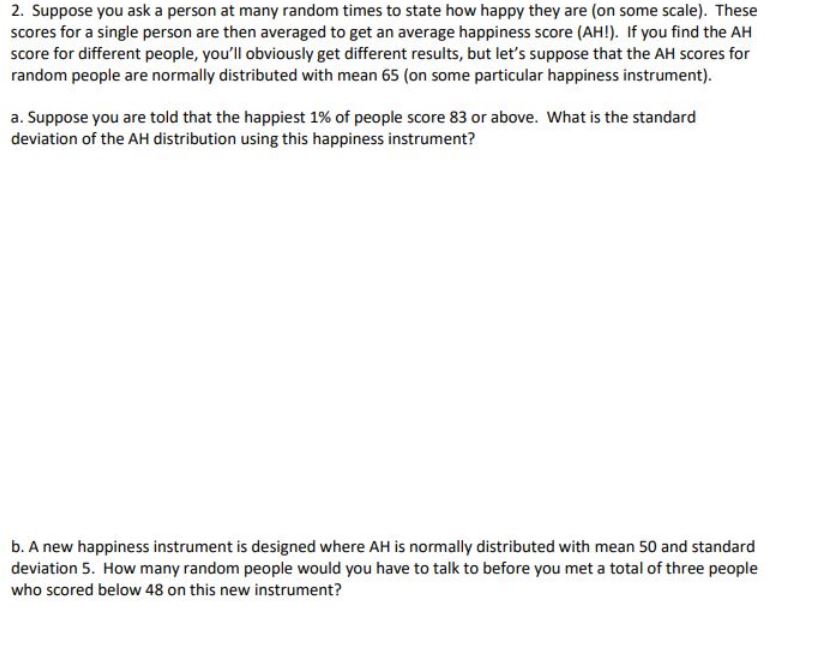
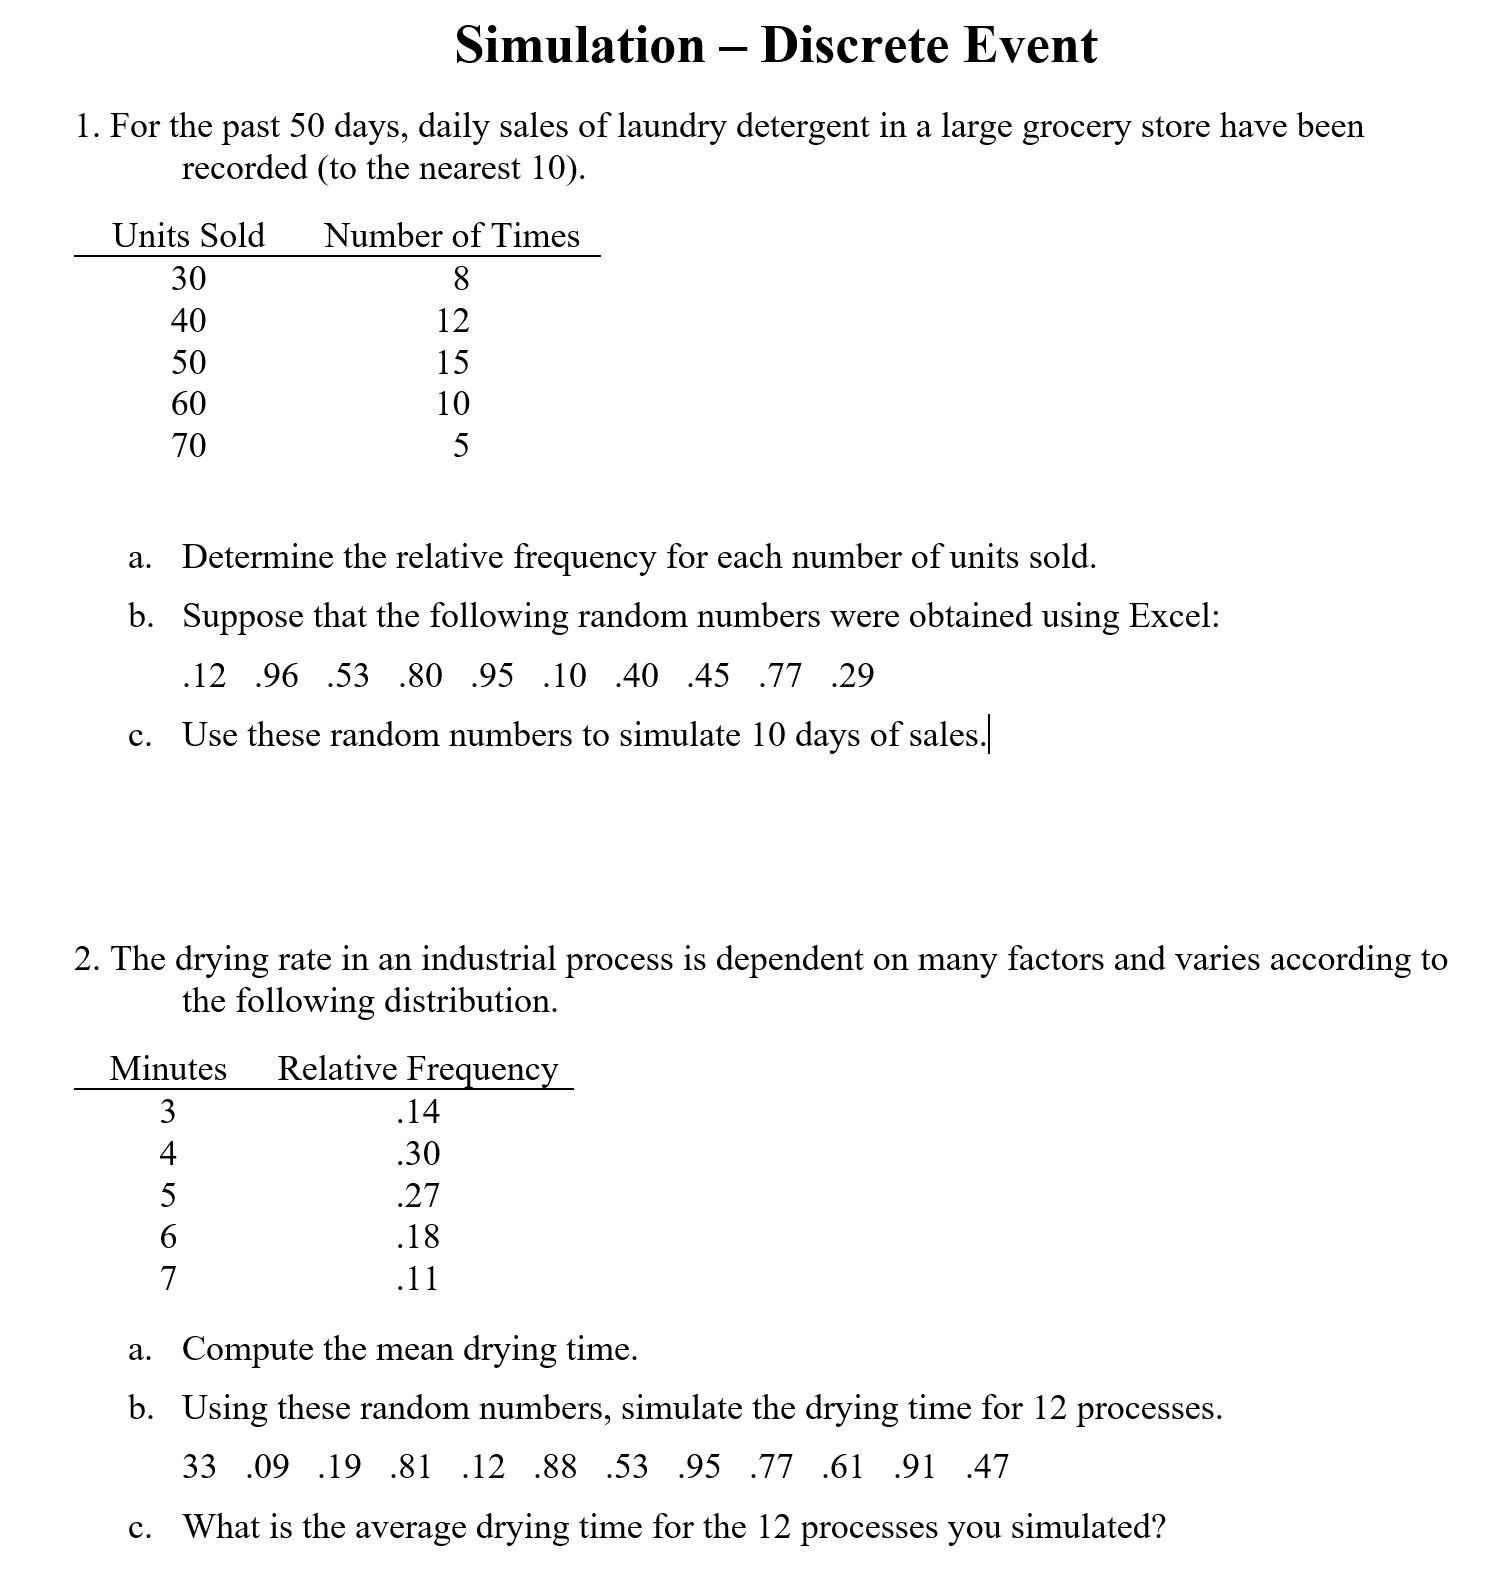
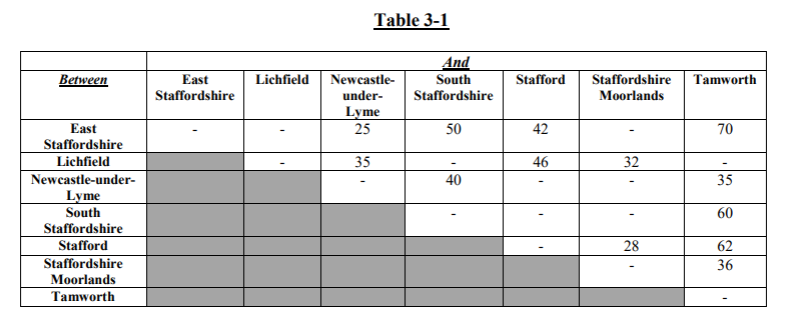
3. Greenfields is a mail order seed and plant business. The size of orders is uniformly distributed over the interval from $25 to $80. Use the following random numbers to generate the size of 10 orders. 41 .99 07 .05 38 .77 .19 .12 .58 .60 4. Using the spreadsheet below, give the cell address which would have the formula shown. Cell Formula Belongs in Cell =VLOOKUP(B18,$B$10:$C$12,2) =VLOOKUP(D23,$F$11:$G$14,2) =K19*($I$16-119) =VLOOKUP(H27,$B$10:$C$12,2) =AVERAGE(L 18:L27) A B C D E F G H I J K L Argosy Incorporated N N New Product Simulation Argosy is making a new product and is uncertain about two events: the cost of the product, and the demand for the product. Argosy will use simulation to see the affect of varying the selling price. Demand depends on price. Cost will not affect selling price. Distribution of Cost Distribution of Demand MinProb Cost When price is $20 10 When price is $25 0 MinProb Demand MinProb Demand 0.35 10 5000 5000 12 0.75 15 0.20 8000 0.30 8000 0.55 10000 0.75 14 10000 0.85 18000 0.90 18000 15 16 Selling price of 20 Selling price of 25 17 Trial RN Unit cost RN Demand Profi Trial RN Unit cost RN Demand Profit 18 0.8474 15 0.9559 18000 90000 0.7241 19 10 0.6481 0.4034 8000 120000 10 0.1144 5000 50000 0.8654 20 15 0.7253 8000 0.2712 80000 0.5127 3000 6000 0.0732 0.5681 8000 136000 21 0.7370 0.0627 5000 0000 22 0.5631 10 0.9745 8000 0.4245 270000 0.9173 8000 80000 23 0.6018 10 6 0.1009 0.5556 3000 20000 0.6462 0000 20000 6 0.1099 24 0.2879 0.0987 000 35000 0.3423 3000 96000 0.6103 10 0.1906 5000 25 0.3713 75000 0.8377 10000 100900 0.2107 26 0.4779 8000 136000 0.2440 0.7518 10000 120000 27 10 0.0298 10 0.3279 8000 0.6109 136000 0.5009 8000 80000 10 0.2886 g 28 0.7981 10000 170000 Average Profit is 98200 29 Average Profit is 1328002. Suppose you ask a person at many random times to state how happy they are [on some scale}. These scores fora singie person are then averaged to get an average happiness snore [AHIL If you nd the AH score for different people. you'll curiously get different results, but let's suppose that the AH scores for random people are normaily distributed with mean 65 [on some particular happiness instrument}. a. Suppose you are told that the happiest 1% of people score 83 or above. What is the standard deviation of the AH distribution using this happiness instrument? b. A new happiness instrument is designed where AH is normallyI distributed with mean 50 and standard deviation 5. How marryr random peopie would you have to talk to before you met a total ofthree people who scored below 43 on this new instrument? Simulation - Discrete Event 1. For the past 50 days, daily sales of laundry detergent in a large grocery store have been recorded (to the nearest 10). Units Sold Number of Times 30 OC 40 12 50 15 60 10 70 5 a. Determine the relative frequency for each number of units sold. b. Suppose that the following random numbers were obtained using Excel: 12 .96 .53 .80 .95 .10 .40 .45 .77 .29 c. Use these random numbers to simulate 10 days of sales. 2. The drying rate in an industrial process is dependent on many factors and varies according to the following distribution. Minutes Relative Frequency 14 30 a UI A U 27 18 .11 . Compute the mean drying time. b. Using these random numbers, simulate the drying time for 12 processes. 33 .09 .19 .81 .12 .88 .53 .95 .77 .61 91 .47 c. What is the average drying time for the 12 processes you simulated?Table 3-1 And Between East Lichfield Newcastle- South Stafford Staffordshire Tamworth Staffordshire under- Staffordshire Moorlands Lyme East 25 50 42 70 Staffordshire Lichfield 35 46 32 Newcastle-under- 40 35 Lyme South 60 Staffordshire Stafford 28 62 Staffordshire 36 Moorlands Tamworth

Step by Step Solution

There are 3 Steps involved in it

Step: 1

blur-text-image

Get Instant Access to Expert-Tailored Solutions

See step-by-step solutions with expert insights and AI powered tools for academic success

Step: 2

blur-text-image

Step: 3

blur-text-image

Ace Your Homework with AI

Get the answers you need in no time with our AI-driven, step-by-step assistance

Get Started

Recommended Textbook for

Intermediate Algebra With Trigonometry

Authors: Charles P McKeague

1st Edition

1483218759, 9781483218755

More Books

Students also viewed these Mathematics questions

Question

3. Identify the methods used within each of the three approaches.

Answered: 1 week ago