Answered step by step
Verified Expert Solution
Question
1 Approved Answer
Professor Jennings claims that only 35% of the students at Flora College work while attending school. Dean Renata thinks that the professor has underestimated the
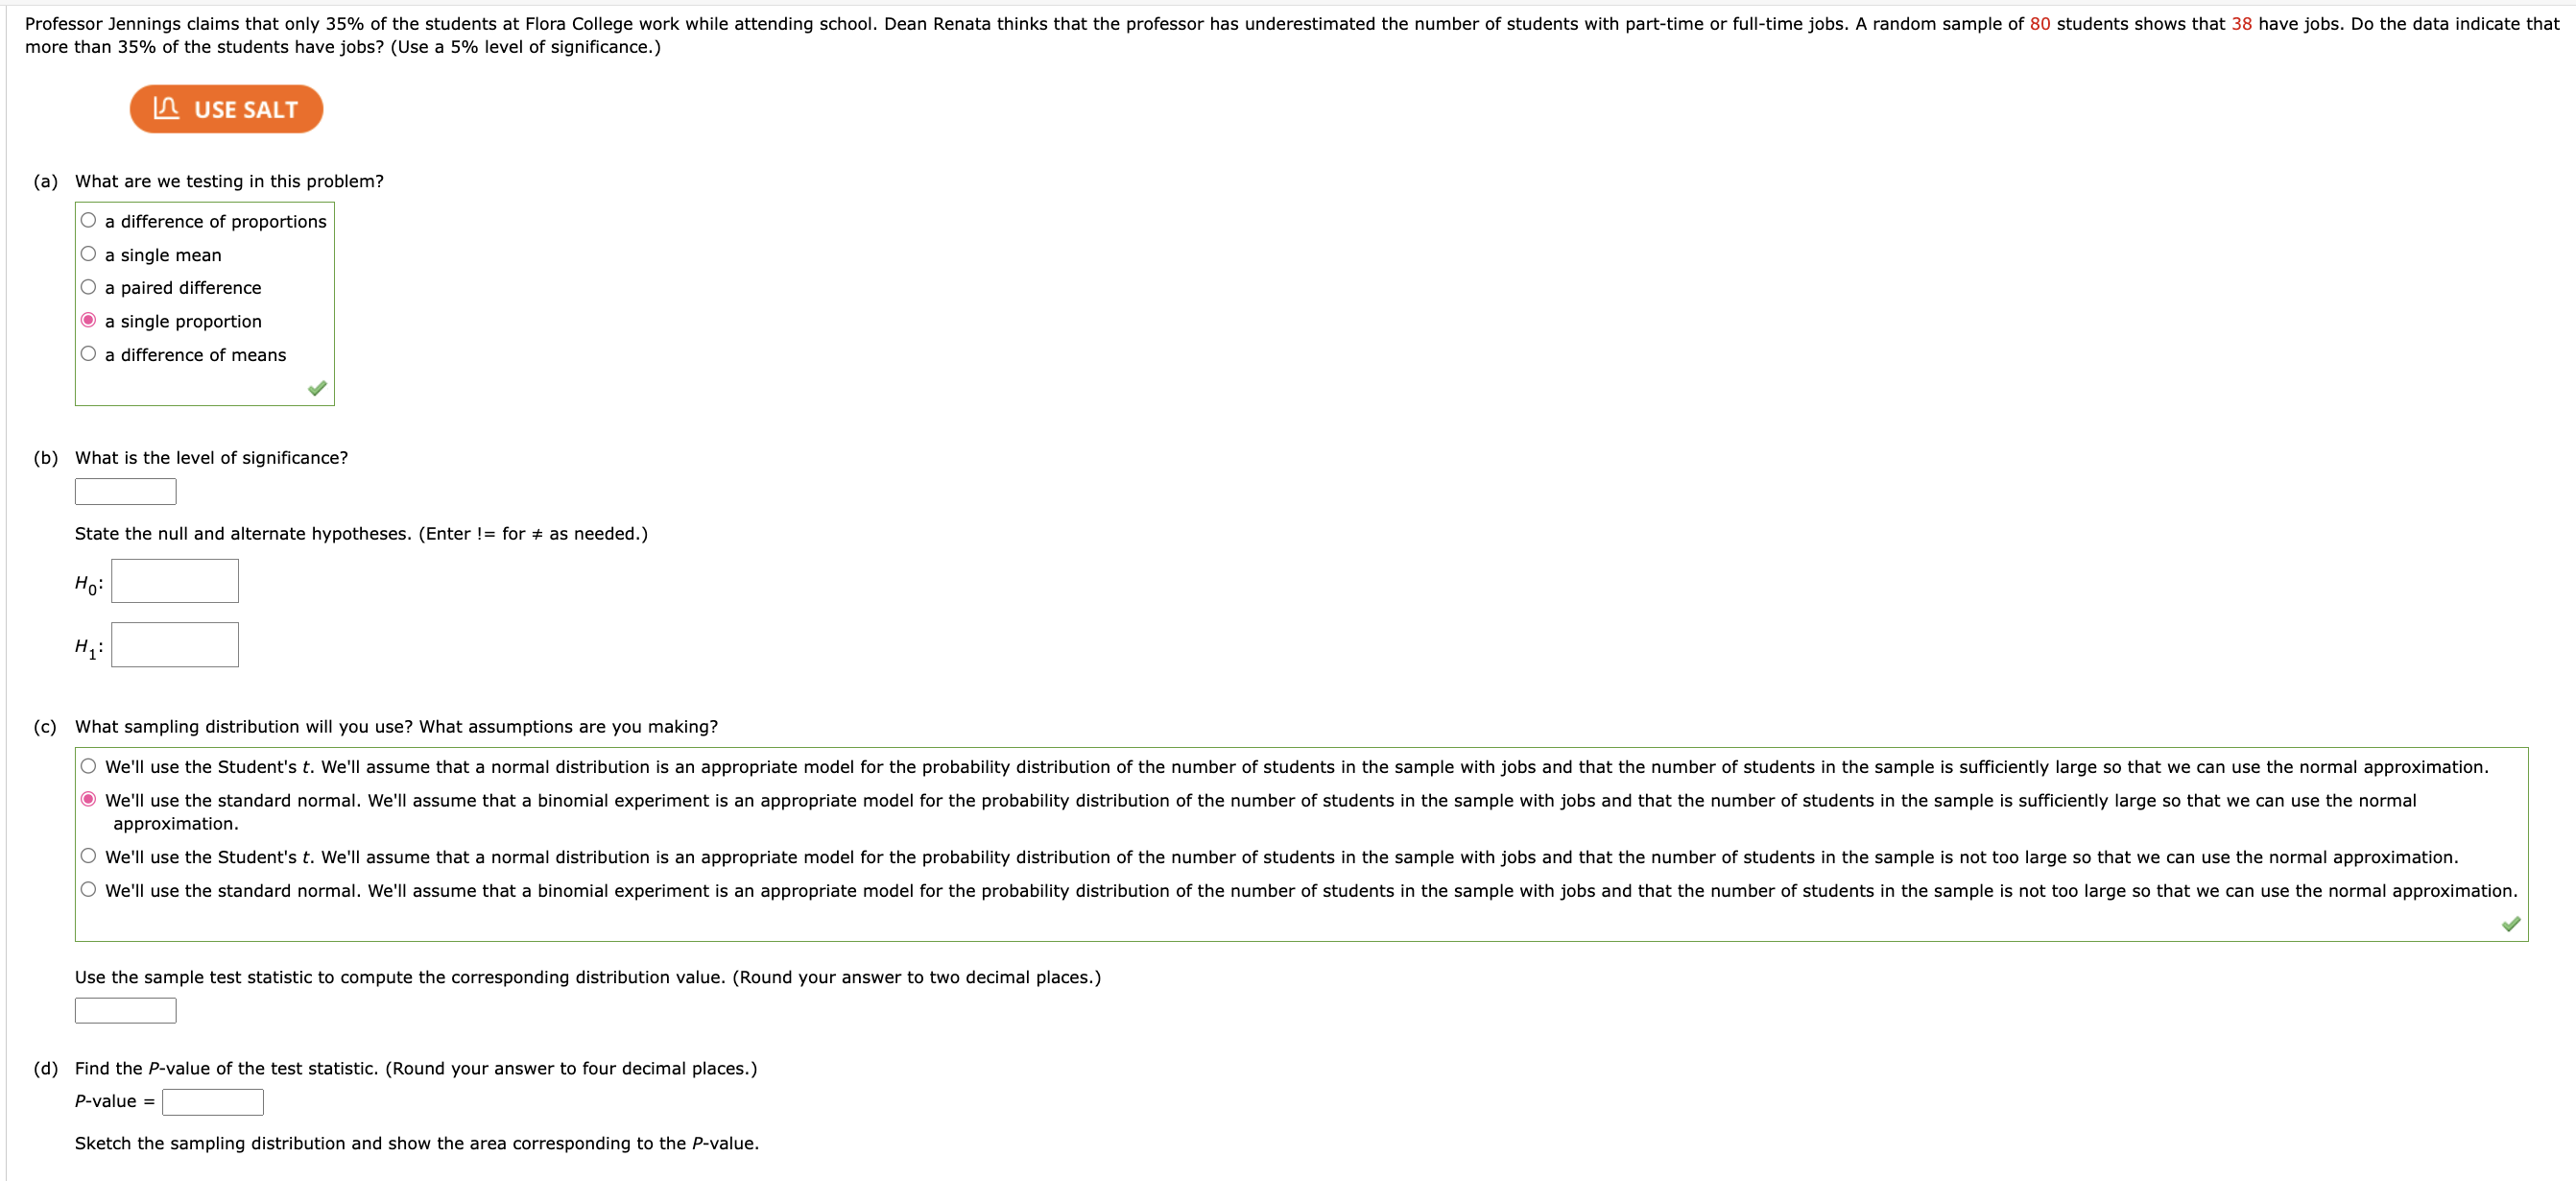
Professor Jennings claims that only 35% of the students at Flora College work while attending school. Dean Renata thinks that the professor has underestimated the number of students with part-time or full-time jobs. A random sample of 80 students shows that 38 have jobs. Do the data indicate that more than 35% of the students have jobs? (Use a 5% level of significance.) N7 1R g (a) What are we testing in this problem? O a difference of proportions O asingle mean O a paired difference a single proportion O a difference of means (b) What is the level of significance? State the null and alternate hypotheses. (Enter != for # as needed.) Ho H. (c) What sampling distribution will you use? What assumptions are you making? O We'll use the Student's t. We'll assume that a normal distribution is an appropriate model for the probability distribution of the number of students in the sample with jobs and that the number of students in the sample is sufficiently large so that we can use the normal approximation. We'll use the standard normal. We'll assume that a binomial experiment is an appropriate model for the probability distribution of the number of students in the sample with jobs and that the number of students in the sample is sufficiently large so that we can use the normal approximation. O We'll use the Student's t. We'll assume that a normal distribution is an appropriate model for the probability distribution of the number of students in the sample with jobs and that the number of students in the sample is not too large so that we can use the normal approximation. O We'll use the standard normal. We'll assume that a binomial experiment is an appropriate model for the probability distribution of the number of students in the sample with jobs and that the number of students in the sample is not too large so that we can use the normal approximation. v Use the sample test statistic to compute the corresponding distribution value. (Round your answer to two decimal places.) J (d) Find the P-value of the test statistic. (Round your answer to four decimal places.) P-value = Sketch the sampling distribution and show the area corresponding to the P-value
Step by Step Solution
There are 3 Steps involved in it
Step: 1
Get Instant Access to Expert-Tailored Solutions
See step-by-step solutions with expert insights and AI powered tools for academic success
Step: 2
Step: 3
Ace Your Homework with AI
Get the answers you need in no time with our AI-driven, step-by-step assistance
Get Started