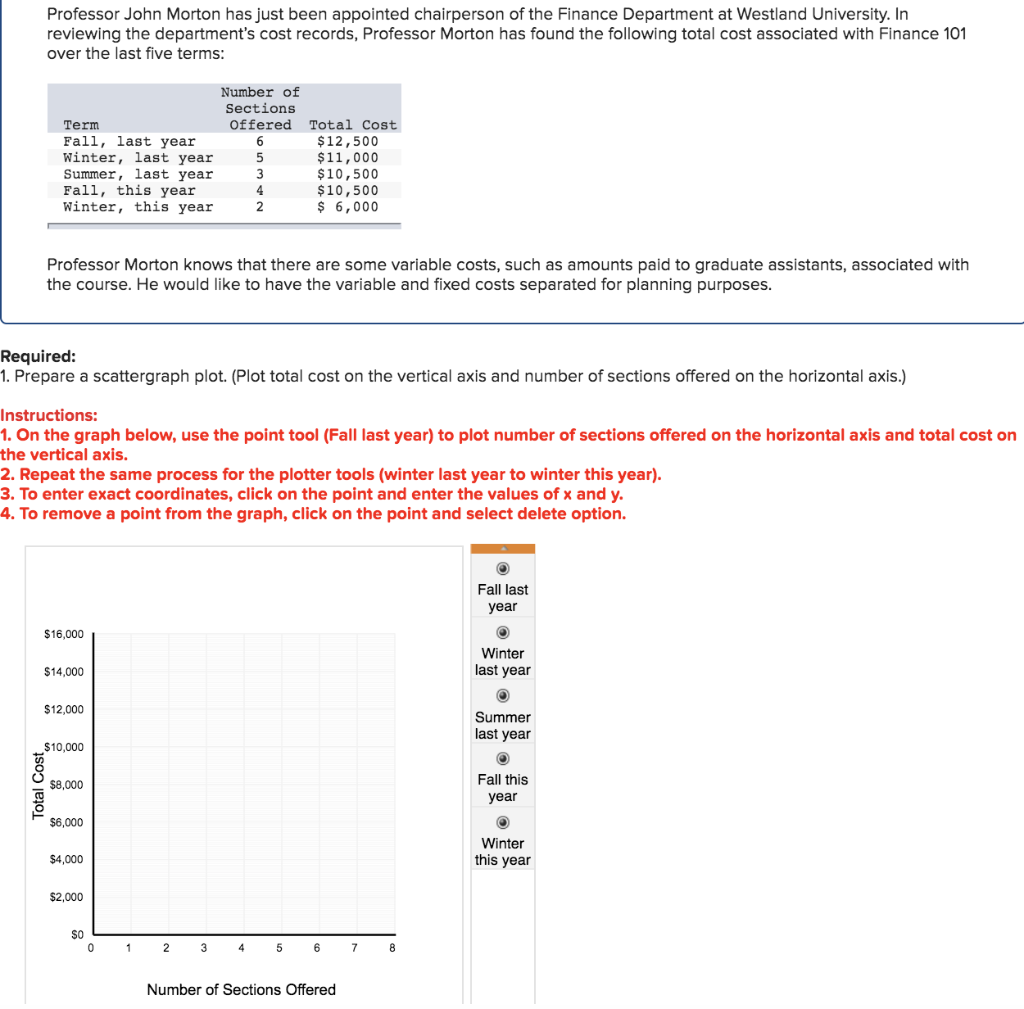
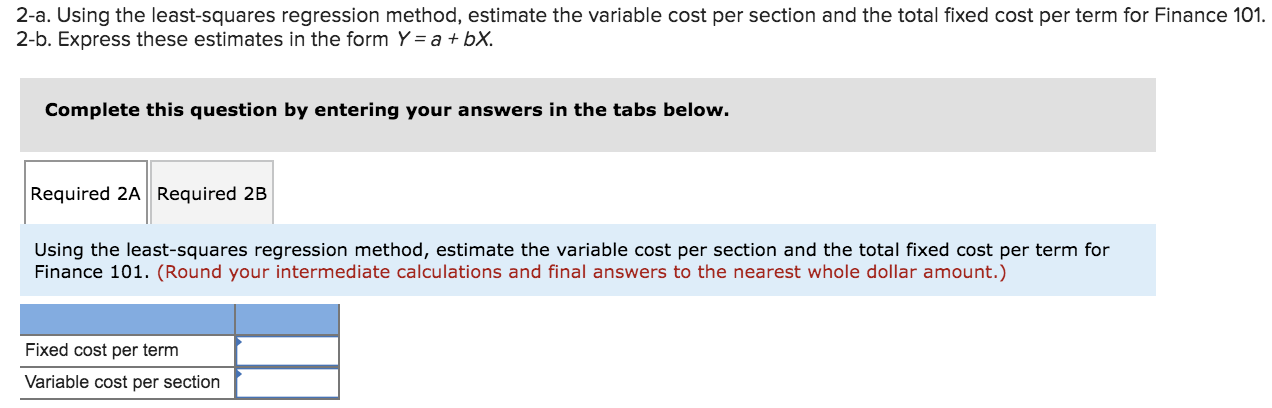
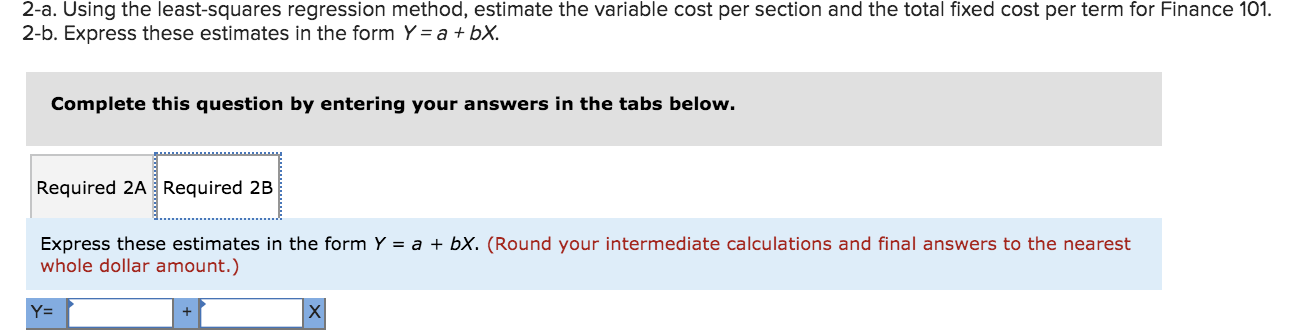
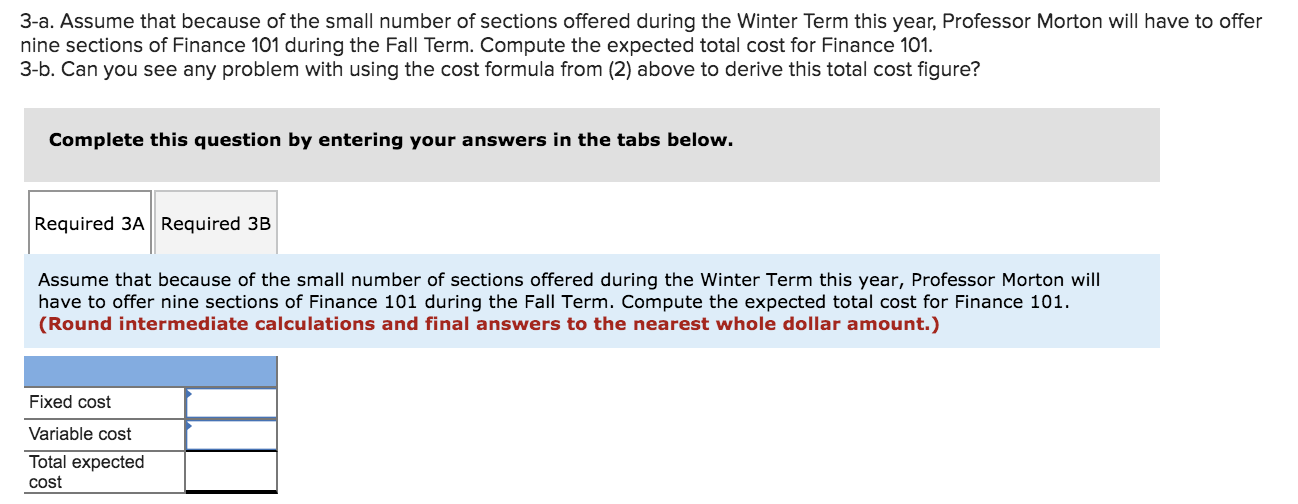
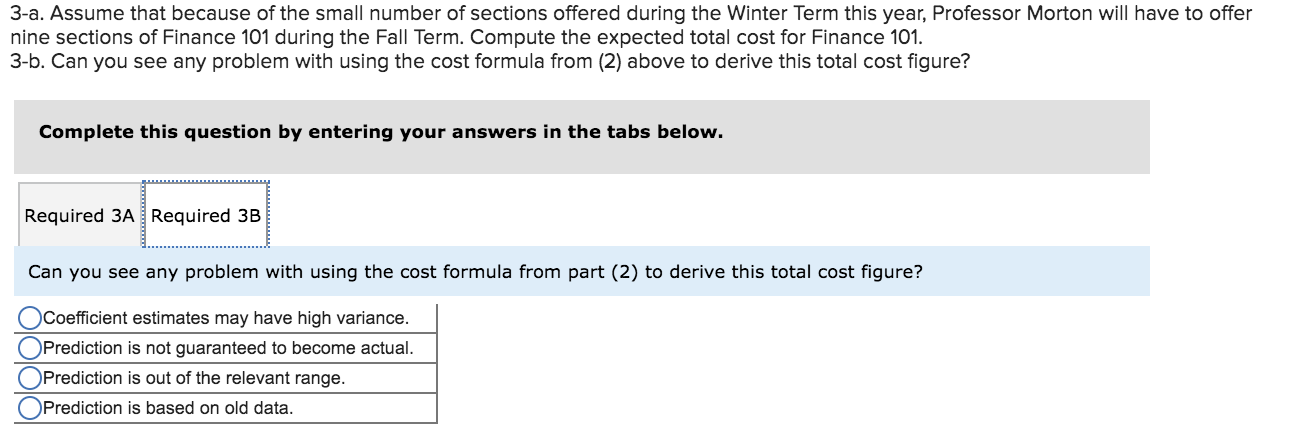
Professor John Morton has just been appointed chairperson of the Finance Department at Westland University. In reviewing the department's cost records, Professor Morton has found the following total cost associated with Finance 101 over the last five terms: Term 6 Number of Sections Offered Total Cost Fall, last year $12,500 Winter, last year $11,000 Summer, last year 3 $10,500 Fall, this year $10,500 Winter, this year $ 6,000 2 Professor Morton knows that there are some variable costs, such as amounts paid to graduate assistants, associated with the course. He would like to have the variable and fixed costs separated for planning purposes. Required: 1. Prepare a scattergraph plot. (Plot total cost on the vertical axis and number of sections offered on the horizontal axis.) Instructions: 1. On the graph below, use the point tool (Fall last year) to plot number of sections offered on the horizontal axis and total cost on the vertical axis. 2. Repeat the same process for the plotter tools (winter last year to winter this year). 3. To enter exact coordinates, click on the point and enter the values of x and y. 4. To remove a point from the graph, click on the point and select delete option. Fall last year $16,000 Winter last year $14,000 $12,000 Summer last year $10,000 Total Cost Fall this year $4,000 Winter this year $2,000 SO 0 1 2 3 4 5 6 7 8 Number of Sections Offered 2-a. Using the least-squares regression method, estimate the variable cost per section and the total fixed cost per term for Finance 101. 2-b. Express these estimates in the form Y = a +bX. Complete this question by entering your answers in the tabs below. Required 2A Required 2B Using the least-squares regression method, estimate the variable cost per section and the total fixed cost per term for Finance 101. (Round your intermediate calculations and final answers to the nearest whole dollar amount.) Fixed cost per term Variable cost per section 2-a. Using the least-squares regression method, estimate the variable cost per section and the total fixed cost per term for Finance 101. 2-b. Express these estimates in the form Y = a +bX. Complete this question by entering your answers in the tabs below. Required 2A Required 2B Express these estimates in the form Y = a + bX. (Round your intermediate calculations and final answers to the nearest whole dollar amount.) Y= 3-a. Assume that because of the small number of sections offered during the Winter Term this year, Professor Morton will have to offer nine sections of Finance 101 during the Fall Term. Compute the expected total cost for Finance 101. 3-b. Can you see any problem with using the cost formula from (2) above to derive this total cost figure? Complete this question by entering your answers in the tabs below. Required 3A Required 3B Assume that because of the small number of sections offered during the Winter Term this year, Professor Morton will have to offer nine sections of Finance 101 during the Fall Term. Compute the expected total cost for Finance 101. (Round intermediate calculations and final answers to the nearest whole dollar amount.) Fixed cost Variable cost Total expected cost 3-a. Assume that because of the small number of sections offered during the Winter Term this year, Professor Morton will have to offer nine sections of Finance 101 during the Fall Term. Compute the expected total cost for Finance 101. 3-b. Can you see any problem with using the cost formula from (2) above to derive this total cost figure? Complete this question by entering your answers in the tabs below. Required 3A Required 3B Can you see any problem with using the cost formula from part (2) to derive this total cost figure? Coefficient estimates may have high variance. OPrediction is not guaranteed to become actual. Prediction is out of the relevant range. Prediction is based on old data