

Question: Source: City Engineering Department Pressure (psi) 68.3 72.6 92.6 56.7 57.6 42.5 67.0 85.2 62.1 63.1 33.1 65.3 77.6 70.1 48.8 Note: Data is
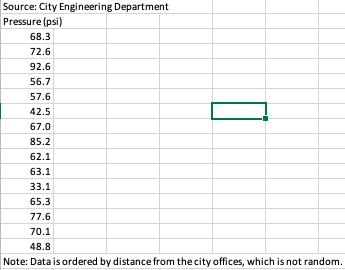
Source: City Engineering Department Pressure (psi) 68.3 72.6 92.6 56.7 57.6 42.5 67.0 85.2 62.1 63.1 33.1 65.3 77.6 70.1 48.8 Note: Data is ordered by distance from the city offices, which is not random. A city engineering department is designing a monitoring program for water pressure in their system of water mains to determine if upgrades are needed. They plan to test the water pressure (measured in pounds per square inch or psi) at a random sample of points to estimate the mean water pressure in the entire system, and need to determine the optimal sample size, considering two factors: a. At each point selected, there is a probability of 0.1 that they will need to wait for a localized pressure drop to equalize. If this happens more than twice during a sampling trip, it is unlikely their technician will be able to complete all of the measurements in a day. They would like to minimize the probability that this happens. b. They need to estimate the mean water pressure in the system at 99% confidence with a margin of error of no more than 15 psi. They have guessed that the optimal sample size will be between 5 and 15. To explore this, they performed measurements on 15 randomly selected measurement points in the city, which are provided in the. Question. To help them make a decision, perform the following calculation: For the sample of 15, determine the 99% confidence interval, the margin of error, and the probability that more than two localized pressure drops will occur. Take a random sample of 5 points from the 15 provided. For these points, determine the 99% confidence interval, the margin of error, and the probability that more than two localized pressure drops will occur. Present these results in a table. In the Resulting Conclusions section of your memo, clearly explain the meaning of your confidence intervals. Recommend a sample size to the engineering department. You may wish to calculate additional confidence intervals or probabilities. Provide your recommendation in the Resulting Conclusions section and support it with your calculations. Present a conclusion of the analysis |
Step by Step Solution
3.36 Rating (152 Votes )
There are 3 Steps involved in it
b Level of Significance a 001 degree of freedomDFn1 4 t valueta2 4... View full answer

Get step-by-step solutions from verified subject matter experts