Answered step by step
Verified Expert Solution
Question
1 Approved Answer
Profitability analysis The table shows total revenues, cost of goods sold, earrings available for common stockholders, total assels, and stockholders' equity for three companies competing
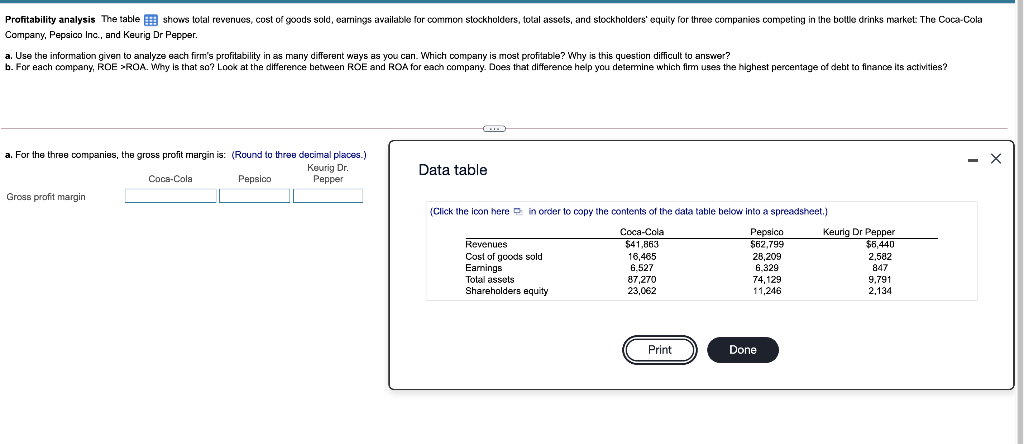
Profitability analysis The table shows total revenues, cost of goods sold, earrings available for common stockholders, total assels, and stockholders' equity for three companies competing in the bolle drinks market: The Coca-Cola Company, Pepsico Inc., and Keurig Dr Pepper. a. Use the information given to analyze each firm's profitability in as many different ways as you can. Which company is most profitable? Why is this question difficult to answer? b. For each company, ROE >ROA. Why is that so? Look at the difference between ROE and ROA for each company. Does that difference help you determine which film uses the highest percentage of debt to finance Its activities? X Data table a. For the three companies, the gross profit margin is: (Round to three decimal places.) Keurig Dr Coca-Cola Pepsico Pepper Gross profit margin (Click the icon here in order to copy the contents of the data table below into a spreadsheet.) Coca-Cola Pepalco Keurig Dr Pepper Revenues $41,863 $62,799 $6.440 Cost of goods sold 28,209 2.582 Earnings 6.527 6.329 847 Tolal assets 87,270 74,129 9.791 Shareholders equity 23,062 11,246 2,134 16,465 ( Print Done
Step by Step Solution
There are 3 Steps involved in it
Step: 1
Get Instant Access to Expert-Tailored Solutions
See step-by-step solutions with expert insights and AI powered tools for academic success
Step: 2
Step: 3
Ace Your Homework with AI
Get the answers you need in no time with our AI-driven, step-by-step assistance
Get Started