Question
Project #2: Comparison of public companies Walmart and Target are two leading retail organizations based in the United States. Both companies are public and file
Project #2: Comparison of public companies
Walmart and Target are two leading retail organizations based in the United States. Both companies are public and file financial statements with the Securities and Exchange Commission. Every day, analysts compare these two companies to compare performance and to aid in investment decisions.
This project asks you to compare the two companies using ratio analysis and to provide reasoning for which you believe to be in better financial position as of the most recent year ended.
Part One Provide all ratios learned in this class
Part Two Based on the ratios from part one, describe who you believe to be in better financial position as of 12/31/2018.
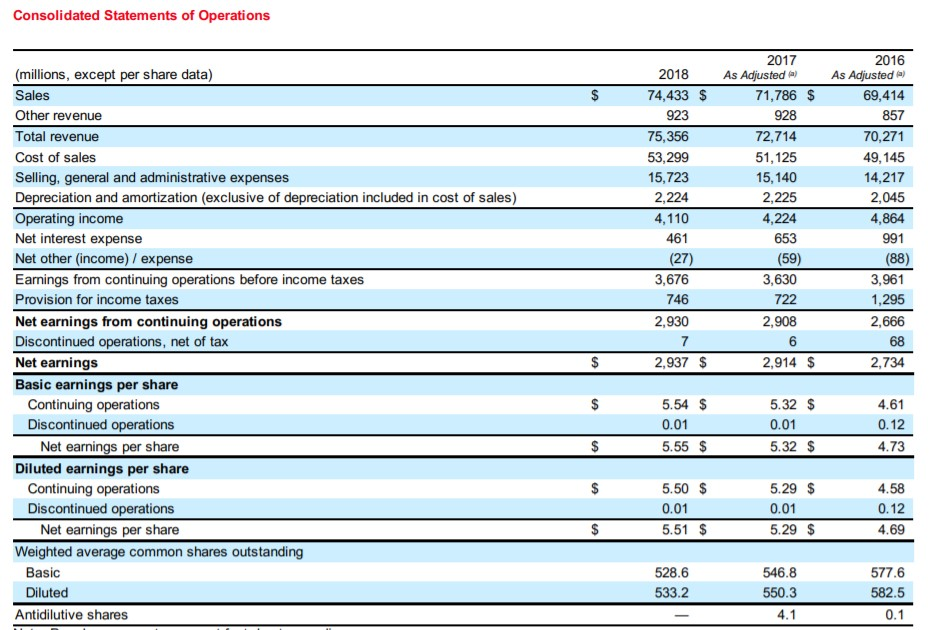
Target income statement

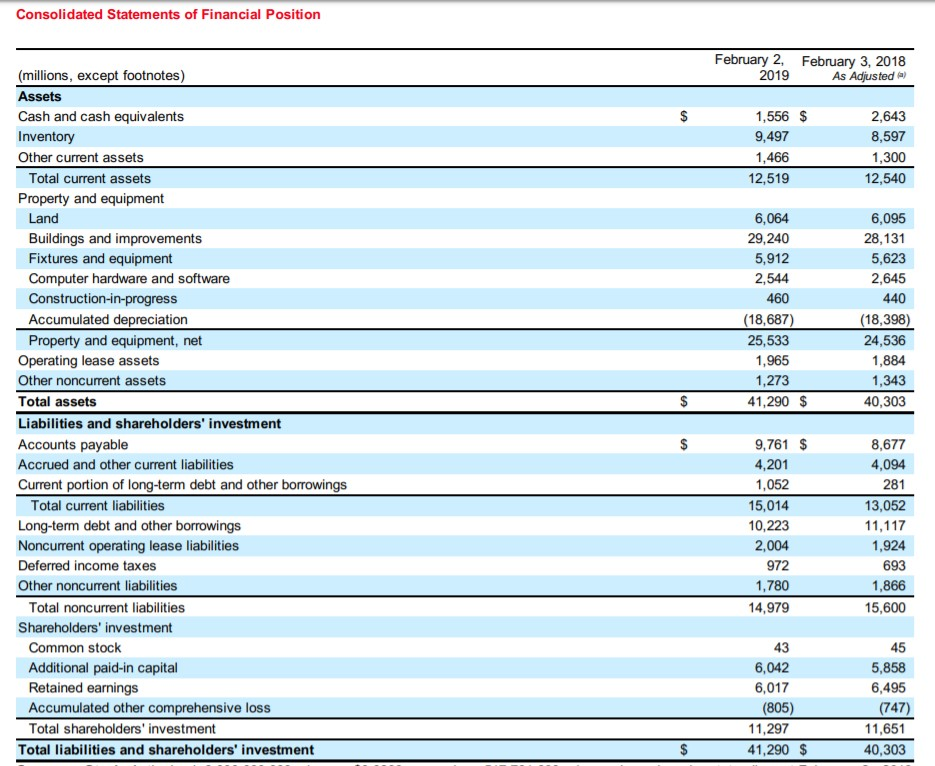
Target Balance Sheet

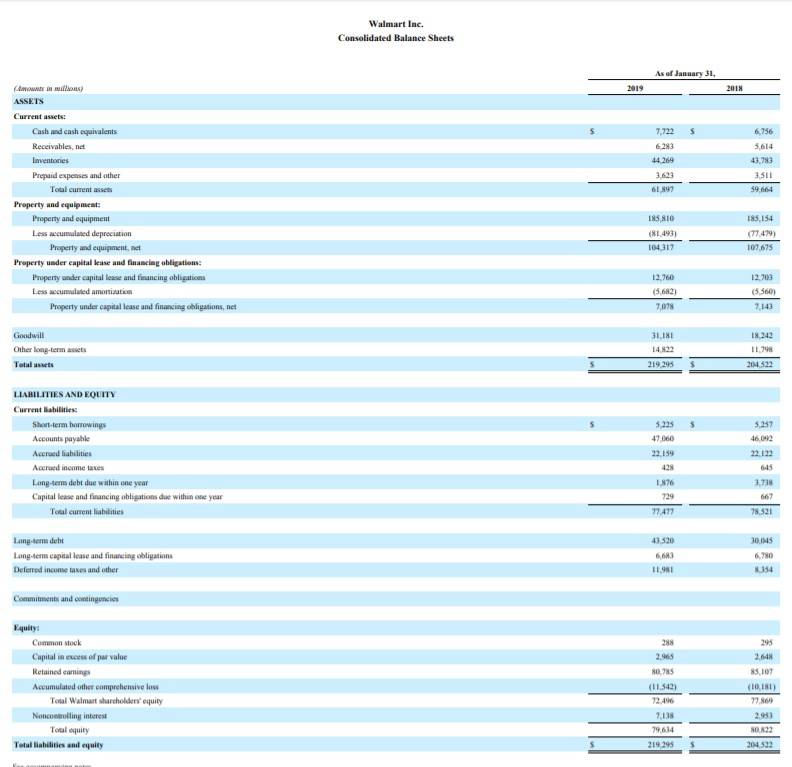
Walmart balance sheet

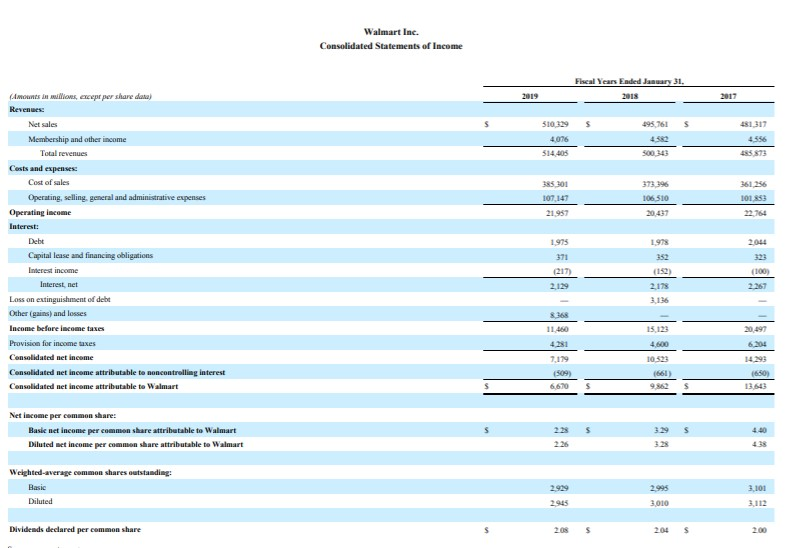
Walmart income statement

Consolidated Statements of Operations 2016 Adjusted ) 69,414 2017 (millions, except per share data) Sales Other revenue Total revenue Cost of sales Selling, general and administrative expenses Depreciation and amortization (exclusive of depreciation included in cost of sales) Operating income Net interest expense Net other (income) / expense Earnings from continuing operations before income taxes Provision for income taxes Net earnings from continuing operations Discontinued operations, net of tax Net earnings Basic earnings per share 2018 As AdjustedAs 71,786 $ 74,433 $ 923 75,356 53,299 15,723 2,224 4,110 461 (27) 3,676 746 2,930 7 928 72,714 51,125 15,140 2,225 4,224 653 (59) 3,630 722 2,908 70,271 49,145 14,217 2,045 4,864 991 (88) 3,961 1,295 2,666 68 2,734 2,937 $ 5.54 S 5.55 $ 5.50 S 5.51 $ 2914 $ 5.32 $ 5.32 S Continuing operations Discontinued operations 4.61 0.12 4.73 0.01 0.01 Net earnings per share Diluted earnings per share 4.58 0.12 4.69 Continuing operations 5.29 S 0.01 5.29 S Discontinued operations Net earnings per share 0.01 Weighted average common shares outstanding Basic Diluted 546.8 550.3 577.6 582.5 528.6 533.2 Antidilutive shares Consolidated Statements of Financial Position February 2, 2019 February 3, 2018 As Adjusteda (millions, except footnotes) Assets Cash and cash equivalents Inventory Other current assets 1,556 $ 9,497 1,466 2,643 8,597 1,300 12,540 Total current assets 12,519 Property and equipment 6,064 29,240 5,912 2,544 460 18.687) 25,533 1,965 1,273 41,290$ Land 6,095 28,131 5,623 2,645 440 (18,398) 24,536 1,884 1,343 40,303 Buildings and improvements Fixtures and equipment Computer hardware and software Construction-in-progress Accumulated depreciation Property and equipment, net Operating lease assets Other noncurrent assets Total assets Liabilities and shareholders' investment Accounts payable Accrued and other current liabilities Current portion of long-term debt and other borrowings 9,761 $ 8,677 4,094 281 13,052 11,117 1,924 693 1,866 15,600 4,201 1,052 15,014 10,223 2,004 972 1,780 14,979 Total current liabilities Long-term debt and other borrowings Noncurrent operating lease liabilities Deferred income taxes Other noncurrent liabilities Total noncurrent liabilities Shareholders' investment Common stock Additional paid-in capital Retained earnings Accumulated other comprehensive loss Total shareholders' investment 43 6,042 6,017 (805) 11,297 45 5,858 6,495 (747) 11,651 40,303 Total liabilities and shareholders' investment 41,290 $ Walmart Inc. Consolidated Balance Sheets As of January 31, Current assets: 7,722 S Cash and cash equivalents Receivables, net 6,756 Prepaid expenses and other 3.511 Total current assets 59.664 61,897 Property and equipmest: Property and equipment Less accumulated depreciation 185,154 77,479) 107,675 185,810 81,493) Property and equipment, net Property uader capital lease and financing abligations: Property under capital lease and financing obligations 12,760 5,682) 7,078 12,703 (5,560) Property under capital lease and financing obligations, net 1,798 Other long-term assets Total assets 219 295 S 204.522 LIABILITIES AND EQUITY Current Babilities Short-term bonowings Accounts payable Acerued habilities Aceraed income taxes Long-ses debt due within one year Capital lease and financing obligations due within one year 5,225 47,060 22,159 46,0%2 3,738 1,876 Total current labilities Long-iens debt Long-ens capital lease and financing obligations Deferred income taxes and other 6 780 11981 Common stock Capital in excess of par value Relained eamings Accumulated other comprehensive loss 85,107
Step by Step Solution
There are 3 Steps involved in it
Step: 1

Get Instant Access to Expert-Tailored Solutions
See step-by-step solutions with expert insights and AI powered tools for academic success
Step: 2

Step: 3

Ace Your Homework with AI
Get the answers you need in no time with our AI-driven, step-by-step assistance
Get Started


