Answered step by step
Verified Expert Solution
Question
1 Approved Answer
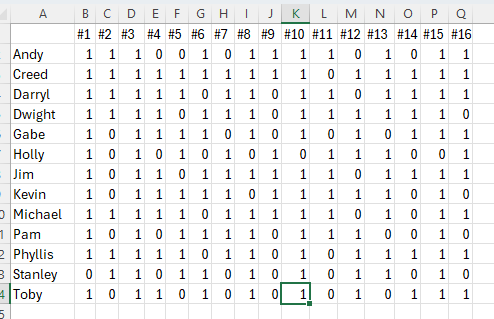
Project - Exam Scores Picture of Excel Spreadsheet of student's scores is at the bottom of this page. (5 pts) Use Excel to calculate the
Project - Exam Scores
Picture of Excel Spreadsheet of student's scores is at the bottom of this page.
- (5 pts) Use Excel to calculate the frequency and percentage of correct answers for each student. Picture of scores on the bottom of page.
| Student | Frequency | Percentage |
| Andy | ||
| Creed | ||
| Darryl | ||
| Dwight | ||
| Gabe | ||
| Holly | ||
| Jim | ||
| Kevin | ||
| Michael | ||
| Pam | ||
| Phyllis | ||
| Stanley | ||
| Toby |
- (5 pts) Based on these percentages, determine the number of students who earned an A, B, C, D, and F on the exam. A = 90-100%, B = 80-89%, C = 70-79%, D = 60-69%, and F = 0-59% scale.
| Grade | Number of students |
| A | |
| B | |
| C | |
| D | |
| F |
- (5 pts) Use this information to make a pie chart showing the percentage of students who earned each grade. Make sure the percentages are labeled on your pie chart.
Paste your pie chart here:
- (5 pts) Use Excel to calculate the number of correct responses for each question. In other words, determine how many students got question #1 correct? How many got question #2 correct? How many got question #3 correct? And so on.
| Question | Frequency |
| #1 | |
| #2 | |
| #3 | |
| #4 | |
| #5 | |
| #6 | |
| #7 | |
| #8 | |
| #9 | |
| #10 | |
| #11 | |
| #12 | |
| #13 | |
| #14 | |
| #15 | |
| #16 |
- (5 pts) Make a bar graph showing the number of students who answered each question correctly.
Paste your bar graph here:
- (5 pts) Choose two students and create a Venn diagram showing the relationship between the students and the problems they each got correct.
Paste your Venn diagram here:
- (6 pts) Answer the following questions:
- How many students got question 4 and question 6 correct?
- How many students got question 4 or question 6 correct?
- How many students got question 10 and question 15 correct?
- How many students got question 10 or question 15 correct?
- How many students got question 3 incorrect and question 5 correct?
- How many students got question 3 correct and question 5 incorrect?
- (15 pts) Take a teacher's point of view to analyze the test to see if any question(s) should be thrown out, changed, or altered in any way.
- Your response can include the answers to these assumptions:
- Base your answer on these assumptions
- Questions #1-4 are adding fractions.
- Questions #5-8 are subtracting fractions.
- Questions #9-12 are multiplying fractions.
- Questions #13-16 are dividing fractions.
- Students are not able to use calculators on the test.
- Based on the data give at least three reasons why question(s) should or should not be thrown out, changed, or altered.
- Explain and show any work needed for this calculation.
- Describe the assumptions in making your judgments.
- Provide compelling rationale for why each assumption is appropriate or inappropriate.
- Explain whether and how your findings are valid.
- Explain whether and how your findings are reasonable.
- Provide deep and thoughtful judgments, drawing insightful, carefully qualified conclusions from the test data.
- (3 pts)Describe how this project fulfills the Gen Ed Outcomes (Interpretation, Representation, Calculation, Application/Analysis, Assumptions, Communication).
- (3 pts)Describe how this MAT-118 course is essential for one's professional education program as well as expanding other long-term career path options.

Step by Step Solution
There are 3 Steps involved in it
Step: 1

Get Instant Access to Expert-Tailored Solutions
See step-by-step solutions with expert insights and AI powered tools for academic success
Step: 2

Step: 3

Ace Your Homework with AI
Get the answers you need in no time with our AI-driven, step-by-step assistance
Get Started


