Answered step by step
Verified Expert Solution
Question
1 Approved Answer
project management Based on the proposal below, kindly find the following as per stated in methodology and explain on the result. You should use table
project management 

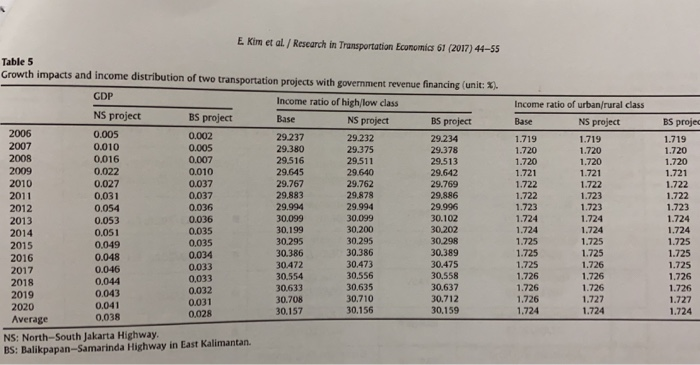
Based on the proposal below, kindly find the following as per stated in methodology and explain on the result. You should use table 5 as your data. Then, provide a conclusion from the data analysis as well.


Assume tax is = 0
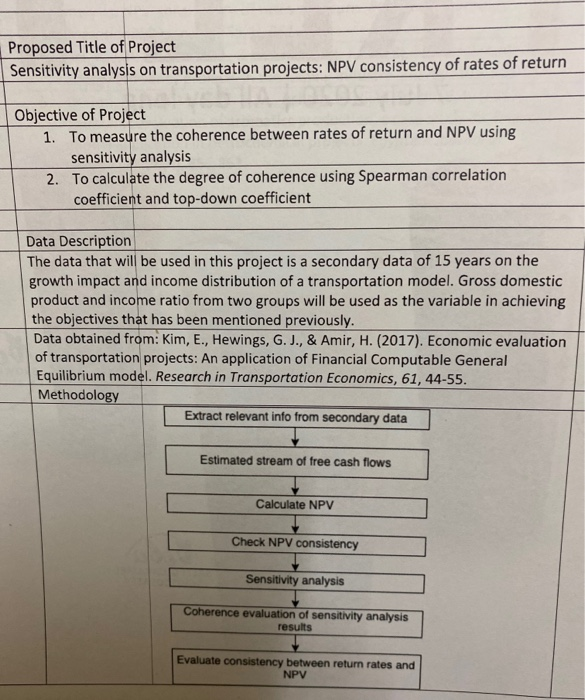
Proposed Title of Project Sensitivity analysis on transportation projects: NPV consistency of rates of return Objective of Project 1. To measure the coherence between rates of return and NPV using sensitivity analysis 2. To calculate the degree of coherence using Spearman correlation coefficient and top-down coefficient Data Description The data that will be used in this project is a secondary data of 15 years on the growth impact and income distribution of a transportation model. Gross domestic product and income ratio from two groups will be used as the variable in achieving the objectives that has been mentioned previously. Data obtained from: Kim, E., Hewings, G. J., & Amir, H. (2017). Economic evaluation of transportation projects: An application of Financial Computable General Equilibrium model. Research in Transportation Economics, 61, 44-55. Methodology Extract relevant info from secondary data Estimated stream of free cash flows Calculate NPV Check NPV consistency Sensitivity analysis Coherence evaluation of sensitivity analysis results Evaluate consistency between return rates and NPV BS projec E Kim et al / Research in Transportation Economics 61 (2017) 44-55 Table 5 Growth impacts and income distribution of two transportation projects with government revenue financing (unit: *). GDP Income ratio of high/low class NS project BS project Base NS project BS project 2006 0.005 0.002 29.237 29.232 29.234 2007 0.010 0.005 29.380 29.375 29.378 2008 0.016 0.007 29.516 29.511 29.513 2009 0.022 0.010 29.645 29.640 29.642 2010 0.027 0.037 29.767 29.762 29.769 2011 0.031 0.037 29.883 29.878 29.886 2012 0.054 0.036 29.994 29.994 29.996 2013 0.036 30.099 30.099 30.102 2014 0.051 0.035 30.199 30.200 30.202 2015 0.049 0.035 30.295 30.295 30.298 0.048 2016 0.034 30.386 30.386 30.389 2017 0.046 0.033 30.472 30.473 30.475 30,554 30.556 0,033 0,044 2018 30.558 30.633 30.635 30.637 2019 0.043 30.708 0.031 30.710 30.712 2020 0,028 30.157 0,038 30.156 30.159 Average NS: North-South Jakarta Highway BS: Balikpapan-Samarinda Highway in East Kalimantan Income ratio of urban/rural class Base NS project 1.719 1.719 1.720 1.720 1.720 1.720 1.721 1.721 1.722 1.722 1.722 1.723 1.723 1.723 1.724 1.724 1.724 1.724 1.725 1.725 1.725 1.725 1.725 1.726 1.726 1.726 1.726 1.726 1.726 1.727 1.724 0.053 1.719 1.720 1.720 1.721 1.722 1.722 1.723 1.724 1.724 1.725 1.725 1.725 1.726 1.726 1.727 1.724 0.032 0.041 1.724 Proposed Title of Project Sensitivity analysis on transportation projects: NPV consistency of rates of return Objective of Project 1. To measure the coherence between rates of return and NPV using sensitivity analysis 2. To calculate the degree of coherence using Spearman correlation coefficient and top-down coefficient Data Description The data that will be used in this project is a secondary data of 15 years on the growth impact and income distribution of a transportation model. Gross domestic product and income ratio from two groups will be used as the variable in achieving the objectives that has been mentioned previously. Data obtained from: Kim, E., Hewings, G. J., & Amir, H. (2017). Economic evaluation of transportation projects: An application of Financial Computable General Equilibrium model. Research in Transportation Economics, 61, 44-55. Methodology Extract relevant info from secondary data Estimated stream of free cash flows Calculate NPV Check NPV consistency Sensitivity analysis Coherence evaluation of sensitivity analysis results Evaluate consistency between return rates and NPV BS projec E Kim et al / Research in Transportation Economics 61 (2017) 44-55 Table 5 Growth impacts and income distribution of two transportation projects with government revenue financing (unit: *). GDP Income ratio of high/low class NS project BS project Base NS project BS project 2006 0.005 0.002 29.237 29.232 29.234 2007 0.010 0.005 29.380 29.375 29.378 2008 0.016 0.007 29.516 29.511 29.513 2009 0.022 0.010 29.645 29.640 29.642 2010 0.027 0.037 29.767 29.762 29.769 2011 0.031 0.037 29.883 29.878 29.886 2012 0.054 0.036 29.994 29.994 29.996 2013 0.036 30.099 30.099 30.102 2014 0.051 0.035 30.199 30.200 30.202 2015 0.049 0.035 30.295 30.295 30.298 0.048 2016 0.034 30.386 30.386 30.389 2017 0.046 0.033 30.472 30.473 30.475 30,554 30.556 0,033 0,044 2018 30.558 30.633 30.635 30.637 2019 0.043 30.708 0.031 30.710 30.712 2020 0,028 30.157 0,038 30.156 30.159 Average NS: North-South Jakarta Highway BS: Balikpapan-Samarinda Highway in East Kalimantan Income ratio of urban/rural class Base NS project 1.719 1.719 1.720 1.720 1.720 1.720 1.721 1.721 1.722 1.722 1.722 1.723 1.723 1.723 1.724 1.724 1.724 1.724 1.725 1.725 1.725 1.725 1.725 1.726 1.726 1.726 1.726 1.726 1.726 1.727 1.724 0.053 1.719 1.720 1.720 1.721 1.722 1.722 1.723 1.724 1.724 1.725 1.725 1.725 1.726 1.726 1.727 1.724 0.032 0.041 1.724 Step by Step Solution
There are 3 Steps involved in it
Step: 1

Get Instant Access to Expert-Tailored Solutions
See step-by-step solutions with expert insights and AI powered tools for academic success
Step: 2

Step: 3

Ace Your Homework with AI
Get the answers you need in no time with our AI-driven, step-by-step assistance
Get Started


