

Answered step by step
Verified Expert Solution
Question
1 Approved Answer
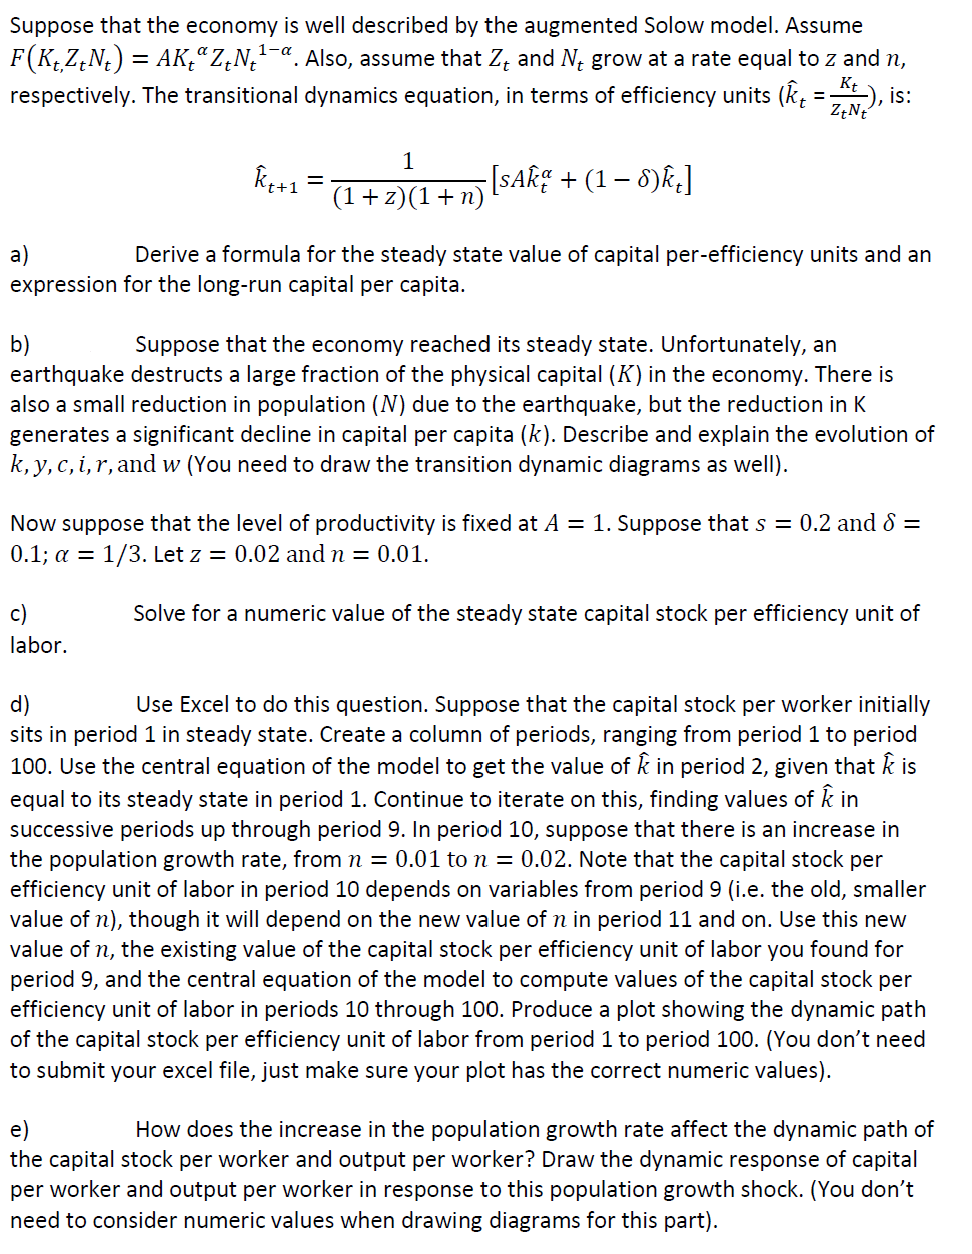
Proper workings/diagrams are appreciated Suppose that the economy is well described by the augmented Solow model. Assume F(Kt,ZtNt)=AKtZtNt1. Also, assume that Zt and Nt grow
Proper workings/diagrams are appreciated
Suppose that the economy is well described by the augmented Solow model. Assume F(Kt,ZtNt)=AKtZtNt1. Also, assume that Zt and Nt grow at a rate equal to z and n, respectively. The transitional dynamics equation, in terms of efficiency units (k^t=ZtNtKt), is: k^t+1=(1+z)(1+n)1[sAk^t+(1)k^t] a) Derive a formula for the steady state value of capital per-efficiency units and an expression for the long-run capital per capita. b) Suppose that the economy reached its steady state. Unfortunately, an earthquake destructs a large fraction of the physical capital (K) in the economy. There is also a small reduction in population (N) due to the earthquake, but the reduction in K generates a significant decline in capital per capita (k). Describe and explain the evolution of k,y,c,i,r, and w (You need to draw the transition dynamic diagrams as well). Now suppose that the level of productivity is fixed at A=1. Suppose that s=0.2 and = 0.1;=1/3. Let z=0.02 and n=0.01. c) Solve for a numeric value of the steady state capital stock per efficiency unit of labor. d) Use Excel to do this question. Suppose that the capital stock per worker initially sits in period 1 in steady state. Create a column of periods, ranging from period 1 to period 100. Use the central equation of the model to get the value of k^ in period 2 , given that k^ is equal to its steady state in period 1. Continue to iterate on this, finding values of k^ in successive periods up through period 9 . In period 10 , suppose that there is an increase in the population growth rate, from n=0.01 to n=0.02. Note that the capital stock per efficiency unit of labor in period 10 depends on variables from period 9 (i.e. the old, smaller value of n ), though it will depend on the new value of n in period 11 and on. Use this new value of n, the existing value of the capital stock per efficiency unit of labor you found for period 9 , and the central equation of the model to compute values of the capital stock per efficiency unit of labor in periods 10 through 100. Produce a plot showing the dynamic path of the capital stock per efficiency unit of labor from period 1 to period 100. (You don't need to submit your excel file, just make sure your plot has the correct numeric values). e) How does the increase in the population growth rate affect the dynamic path of the capital stock per worker and output per worker? Draw the dynamic response of capital per worker and output per worker in response to this population growth shock. (You don't need to consider numeric values when drawing diagrams for this part)Step by Step Solution
There are 3 Steps involved in it
Step: 1

Get Instant Access to Expert-Tailored Solutions
See step-by-step solutions with expert insights and AI powered tools for academic success
Step: 2

Step: 3
Ace Your Homework with AI
Get the answers you need in no time with our AI-driven, step-by-step assistance
Get Started
Management Accounting And Strategic Human Resource Management
Authors: John Innes, Reza Kouhy
1st Edition
1859714862, 978-1859714867