Question
Provide a recommendation on which product launch (A or B) provides the most value to the company in terms of strengthening its financial position, using
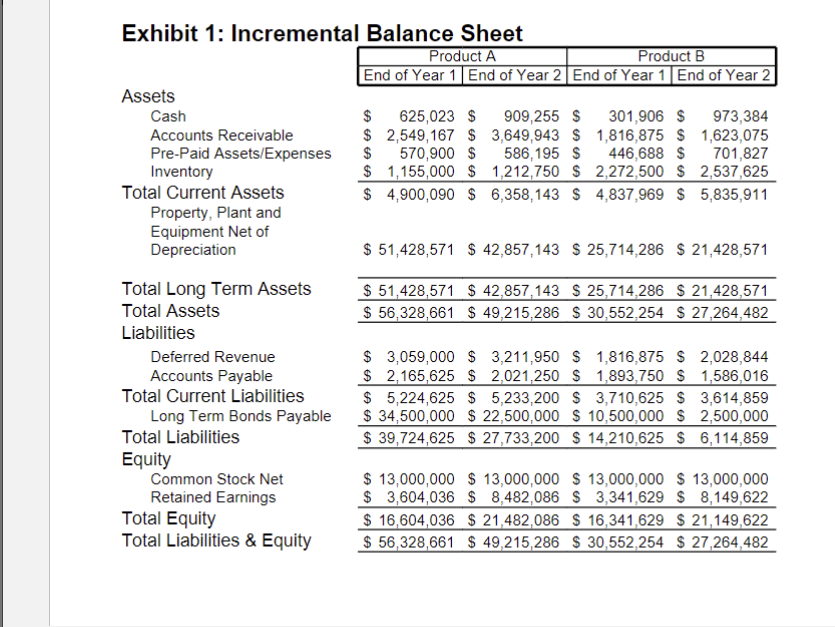
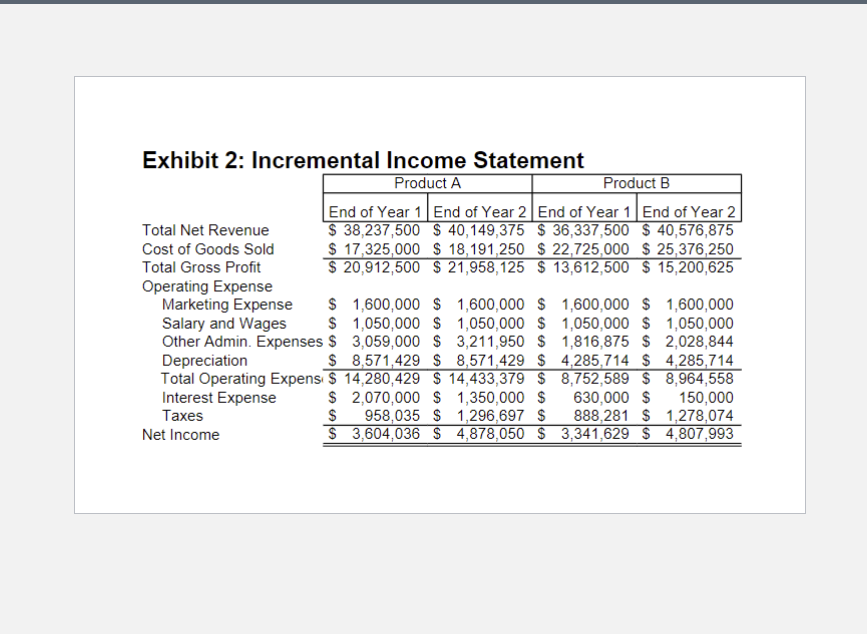
Provide a recommendation on which product launch (A or B) provides the most value to the company in terms of strengthening its financial position, using the "DuPont Method" (also referred to as the "Return on Equity" model), to compare the income statement and balance sheet from both product launches. The analysis will focus on how the company is able to generate returns between these two product launches based on how these two scenarios impact the company's asset utilization, profitability, and leverage ratios,in addition, the company's ability to generate operating cash flow from each product launch.
Per the absolute value: What is the incremental difference inoperatingcash flow between the two product launches, which company product could be considered to have the most value for the company, and what would be the key financial risk versus aspects of return when assuming that the Net Profit Margin is 13%, the Asset Utilization is 1X, and the financial leverage is 1.8X?


Exhibit 1: Incremental Balance Sheet Product A Product B End of Year 1 End of Year 2 | End of Year 1 | End of Year 2 Assets Cash $ Accounts Receivable $ 625,023 $ 2,549,167 $ 909,255 $ 3,649,943 $ 301,906 $ 973,384 1,816,875 $ 1,623,075 Pre-Paid Assets/Expenses $ Inventory 586,195 $ 1,212,750 $ Total Current Assets Property, Plant and Equipment Net of Depreciation Total Long Term Assets Total Assets Liabilities Deferred Revenue Accounts Payable Total Current Liabilities Long Term Bonds Payable Total Liabilities Equity Common Stock Net Retained Earnings Total Equity Total Liabilities & Equity 570,900 $ 446,688 $ 701,827 $ 1,155,000 $ 2,272,500 $ 2,537,625 $ 4,900,090 $ 6,358,143 $ 4,837,969 $ 5,835,911 $ 51,428,571 $ 42,857,143 $ 25,714,286 $ 21,428,571 $ 51,428,571 $ 42,857,143 $ 25,714,286 $ 21,428,571 $ 56,328,661 $ 49,215,286 $ 30,552,254 $ 27,264,482 $ 3,059,000 $ 3,211,950 $ 1,816,875 $ 2,028,844 $ 2,165,625 $ 2,021,250 $ 1,893,750 $ 1,586,016 $ 5,224,625 $ 5,233,200 $ 3,710,625 $ 3,614,859 $ 34,500,000 $ 22,500,000 $10,500,000 $2,500,000 $ 39,724,625 $ 27,733,200 $14,210,625 $ 6,114,859 $13,000,000 $13,000,000 $13,000,000 $13,000,000 $ 3,604,036 $ 8,482,086 $ 3,341,629 $ 8,149,622 $ 16,604,036 $ 21,482,086 $ 16,341,629 $ 21,149,622 $ 56,328,661 $ 49,215,286 $ 30,552,254 $ 27,264,482
Step by Step Solution
There are 3 Steps involved in it
Step: 1

Get Instant Access to Expert-Tailored Solutions
See step-by-step solutions with expert insights and AI powered tools for academic success
Step: 2

Step: 3

Ace Your Homework with AI
Get the answers you need in no time with our AI-driven, step-by-step assistance
Get Started


