Provide me an action plan for netflix with these numbers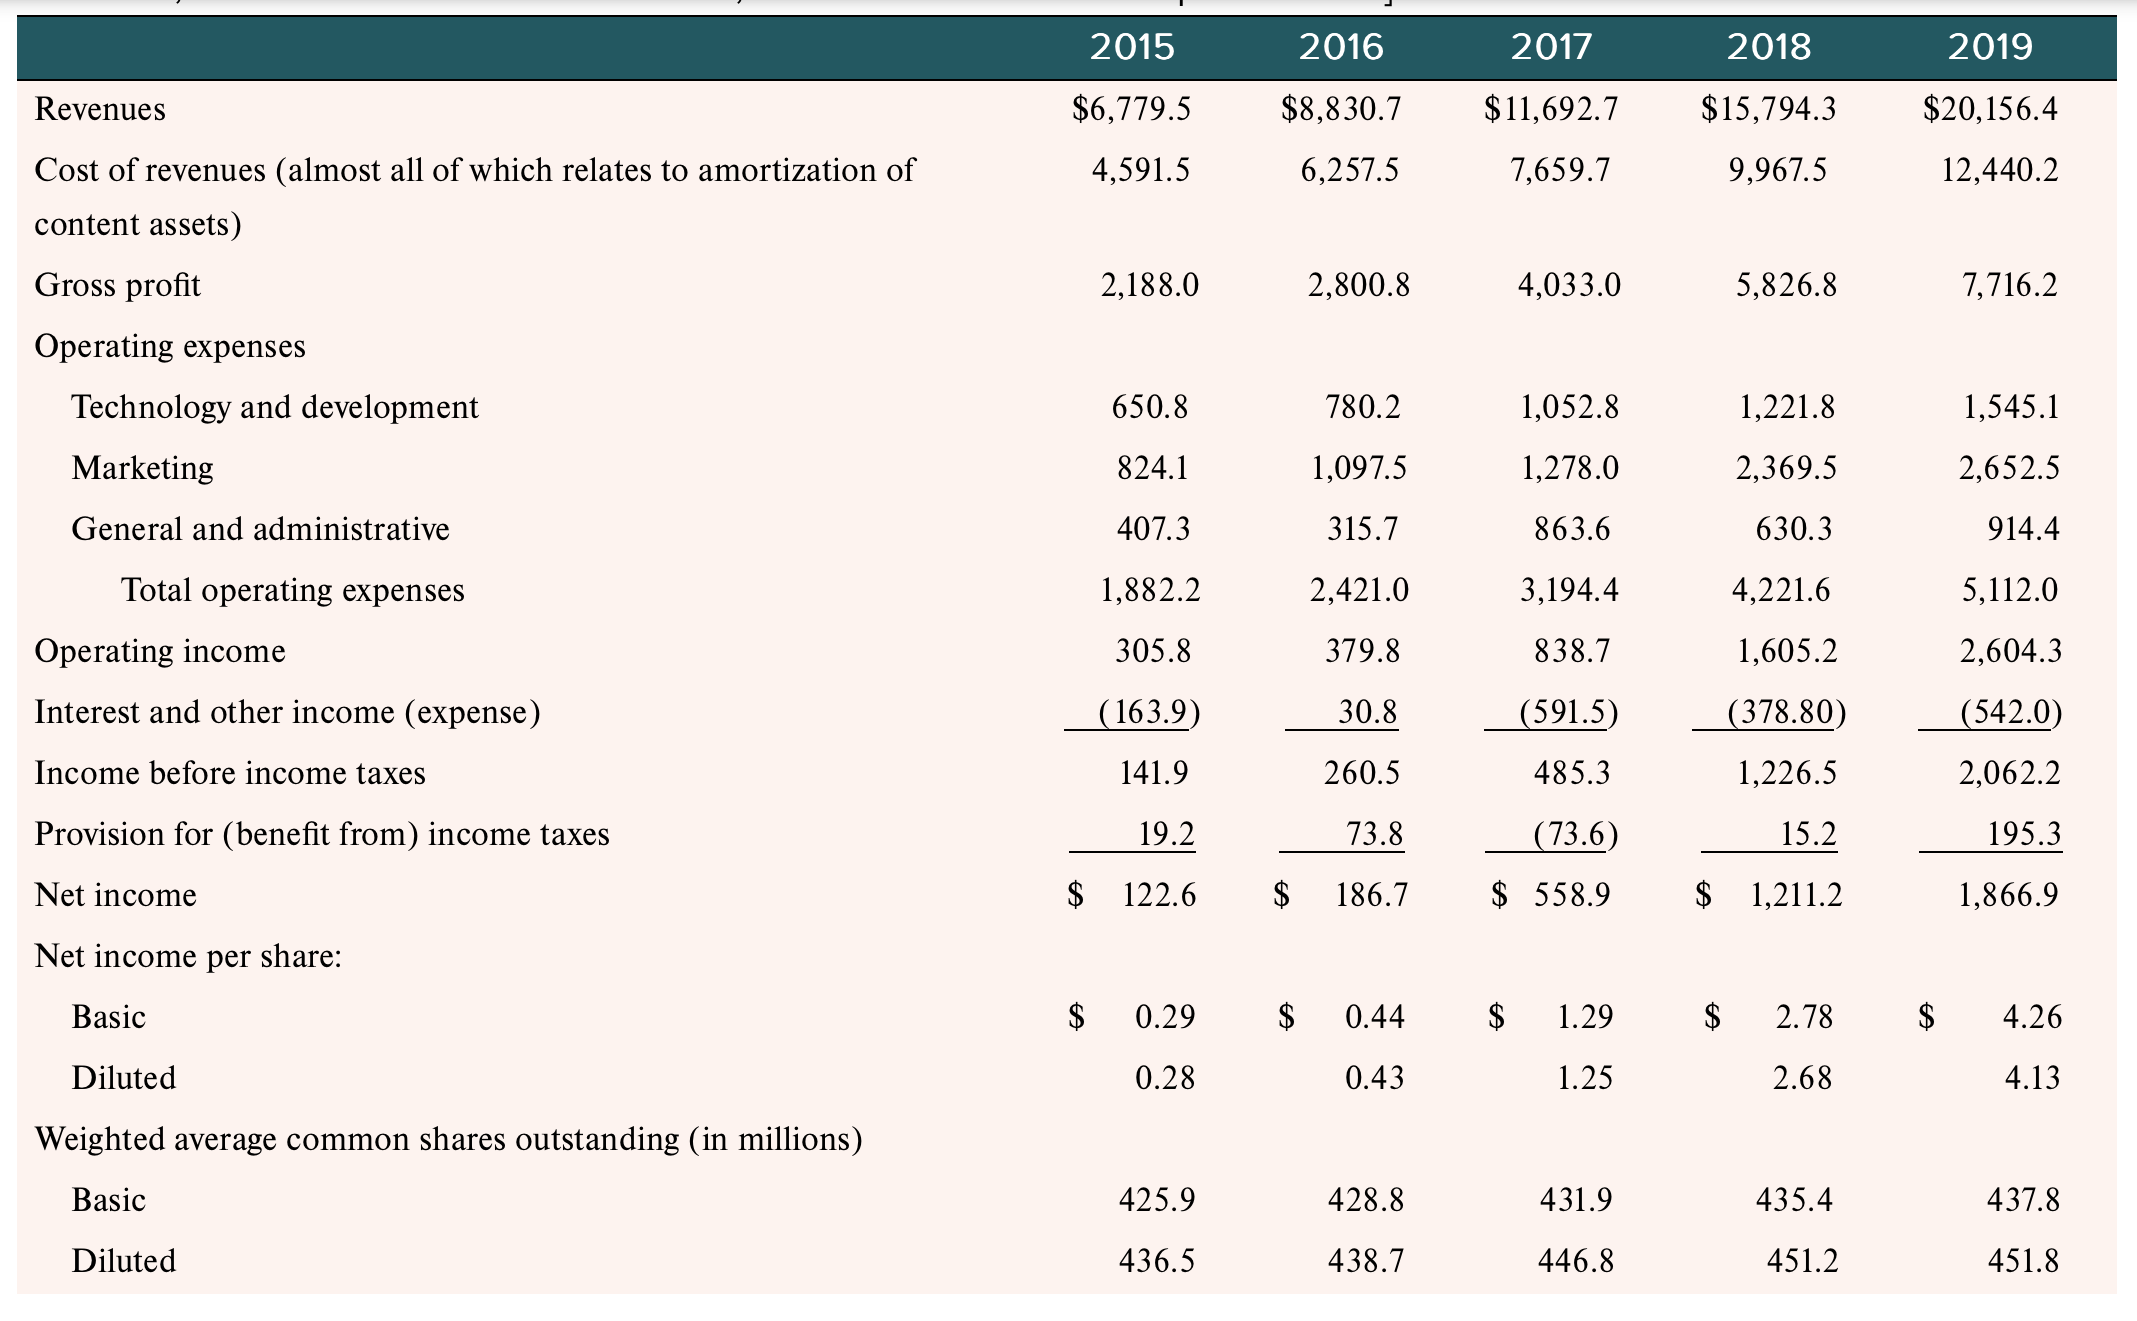
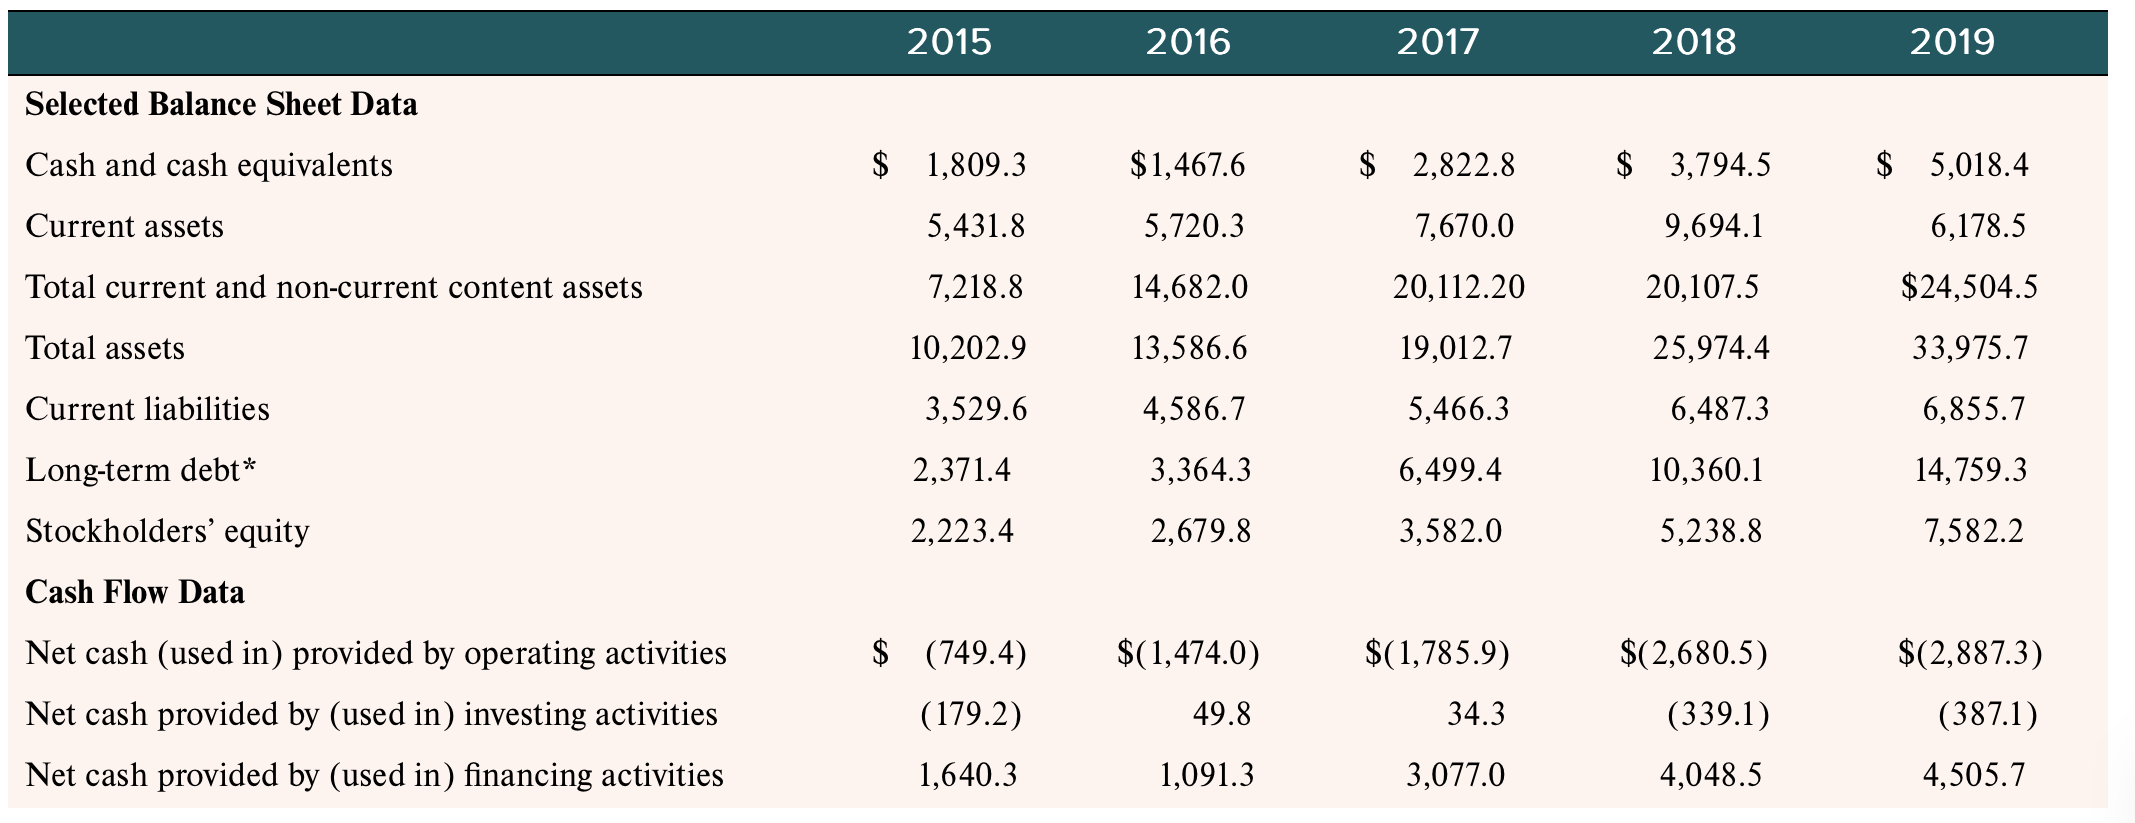
\begin{tabular}{|c|c|c|c|c|c|} \hline & 2015 & 2016 & 2017 & 2018 & 2019 \\ \hline Revenues & $6,779.5 & $8,830.7 & $11,692.7 & $15,794.3 & $20,156.4 \\ \hline Costofrevenues(almostallofwhichrelatestoamortizationofcontentassets) & 4,591.5 & 6,257.5 & 7,659.7 & 9,967.5 & 12,440.2 \\ \hline Gross profit & 2,188.0 & 2,800.8 & 4,033.0 & 5,826.8 & 7,716.2 \\ \hline \multicolumn{6}{|l|}{ Operating expenses } \\ \hline Technology and development & 650.8 & 780.2 & 1,052.8 & 1,221.8 & 1,545.1 \\ \hline Marketing & 824.1 & 1,097.5 & 1,278.0 & 2,369.5 & 2,652.5 \\ \hline General and administrative & 407.3 & 315.7 & 863.6 & 630.3 & 914.4 \\ \hline Total operating expenses & 1,882.2 & 2,421.0 & 3,194.4 & 4,221.6 & 5,112.0 \\ \hline Operating income & 305.8 & 379.8 & 838.7 & 1,605.2 & 2,604.3 \\ \hline Interest and other income (expense) & (163.9) & 30.8 & (591.5) & (378.80) & (542.0) \\ \hline Income before income taxes & 141.9 & 260.5 & 485.3 & 1,226.5 & 2,062.2 \\ \hline Provision for (benefit from) income taxes & 19.2 & 73.8 & (73.6) & 15.2 & 195.3 \\ \hline Net income & $122.6 & $186.7 & $558.9 & $1,211.2 & 1,866.9 \\ \hline \multicolumn{6}{|l|}{ Net income per share: } \\ \hline Basic & 0.29 & 0.44 & 1.29 & 2.78 & 4.26 \\ \hline Diluted & 0.28 & 0.43 & 1.25 & 2.68 & 4.13 \\ \hline \multicolumn{6}{|l|}{ Weighted average common shares outstanding (in millions) } \\ \hline Basic & 425.9 & 428.8 & 431.9 & 435.4 & 437.8 \\ \hline Diluted & 436.5 & 438.7 & 446.8 & 451.2 & 451.8 \\ \hline \end{tabular} \begin{tabular}{lrrrrc} & 2015 & 2016 & 2017 & 2018 & 2019 \\ \hline Selected Balance Sheet Data & & & & & \\ Cash and cash equivalents & $1,809.3 & $1,467.6 & $2,822.8 & $3,794.5 & $5,018.4 \\ Current assets & 5,431.8 & 5,720.3 & 7,670.0 & 9,694.1 & 6,178.5 \\ Total current and non-current content assets & 7,218.8 & 14,682.0 & 20,112.20 & 20,107.5 & $24,504.5 \\ Total assets & 10,202.9 & 13,586.6 & 19,012.7 & 25,974.4 & 33,975.7 \\ Current liabilities & 3,529.6 & 4,586.7 & 5,466.3 & 6,487.3 & 6,855.7 \\ Long-term debt* & 2,371.4 & 3,364.3 & 6,499.4 & 10,360.1 & 14,759.3 \\ Stockholders' equity & 2,223.4 & 2,679.8 & 3,582.0 & 5,238.8 & 7,582.2 \\ Cash Flow Data & & & & & \\ Net cash (used in) provided by operating activities & $(749.4) & $(1,474.0) & $(1,785.9) & $(2,680.5) & $(2,887.3) \\ Net cash provided by (used in) investing activities & (179.2) & 49.8 & 34.3 & (339.1) & (387.1) \\ Net cash provided by (used in) financing activities & 1,640.3 & 1,091.3 & 3,077.0 & 4,048.5 & 4,505.7 \end{tabular} \begin{tabular}{|c|c|c|c|c|c|} \hline & 2015 & 2016 & 2017 & 2018 & 2019 \\ \hline Revenues & $6,779.5 & $8,830.7 & $11,692.7 & $15,794.3 & $20,156.4 \\ \hline Costofrevenues(almostallofwhichrelatestoamortizationofcontentassets) & 4,591.5 & 6,257.5 & 7,659.7 & 9,967.5 & 12,440.2 \\ \hline Gross profit & 2,188.0 & 2,800.8 & 4,033.0 & 5,826.8 & 7,716.2 \\ \hline \multicolumn{6}{|l|}{ Operating expenses } \\ \hline Technology and development & 650.8 & 780.2 & 1,052.8 & 1,221.8 & 1,545.1 \\ \hline Marketing & 824.1 & 1,097.5 & 1,278.0 & 2,369.5 & 2,652.5 \\ \hline General and administrative & 407.3 & 315.7 & 863.6 & 630.3 & 914.4 \\ \hline Total operating expenses & 1,882.2 & 2,421.0 & 3,194.4 & 4,221.6 & 5,112.0 \\ \hline Operating income & 305.8 & 379.8 & 838.7 & 1,605.2 & 2,604.3 \\ \hline Interest and other income (expense) & (163.9) & 30.8 & (591.5) & (378.80) & (542.0) \\ \hline Income before income taxes & 141.9 & 260.5 & 485.3 & 1,226.5 & 2,062.2 \\ \hline Provision for (benefit from) income taxes & 19.2 & 73.8 & (73.6) & 15.2 & 195.3 \\ \hline Net income & $122.6 & $186.7 & $558.9 & $1,211.2 & 1,866.9 \\ \hline \multicolumn{6}{|l|}{ Net income per share: } \\ \hline Basic & 0.29 & 0.44 & 1.29 & 2.78 & 4.26 \\ \hline Diluted & 0.28 & 0.43 & 1.25 & 2.68 & 4.13 \\ \hline \multicolumn{6}{|l|}{ Weighted average common shares outstanding (in millions) } \\ \hline Basic & 425.9 & 428.8 & 431.9 & 435.4 & 437.8 \\ \hline Diluted & 436.5 & 438.7 & 446.8 & 451.2 & 451.8 \\ \hline \end{tabular} \begin{tabular}{lrrrrc} & 2015 & 2016 & 2017 & 2018 & 2019 \\ \hline Selected Balance Sheet Data & & & & & \\ Cash and cash equivalents & $1,809.3 & $1,467.6 & $2,822.8 & $3,794.5 & $5,018.4 \\ Current assets & 5,431.8 & 5,720.3 & 7,670.0 & 9,694.1 & 6,178.5 \\ Total current and non-current content assets & 7,218.8 & 14,682.0 & 20,112.20 & 20,107.5 & $24,504.5 \\ Total assets & 10,202.9 & 13,586.6 & 19,012.7 & 25,974.4 & 33,975.7 \\ Current liabilities & 3,529.6 & 4,586.7 & 5,466.3 & 6,487.3 & 6,855.7 \\ Long-term debt* & 2,371.4 & 3,364.3 & 6,499.4 & 10,360.1 & 14,759.3 \\ Stockholders' equity & 2,223.4 & 2,679.8 & 3,582.0 & 5,238.8 & 7,582.2 \\ Cash Flow Data & & & & & \\ Net cash (used in) provided by operating activities & $(749.4) & $(1,474.0) & $(1,785.9) & $(2,680.5) & $(2,887.3) \\ Net cash provided by (used in) investing activities & (179.2) & 49.8 & 34.3 & (339.1) & (387.1) \\ Net cash provided by (used in) financing activities & 1,640.3 & 1,091.3 & 3,077.0 & 4,048.5 & 4,505.7 \end{tabular}