Answered step by step
Verified Expert Solution
Question
1 Approved Answer
provide plots of all requested signals as well as your MATLAB code. PLEASE LABEL ALL X AND Y AXES IN PLOTS. 1. The signal in

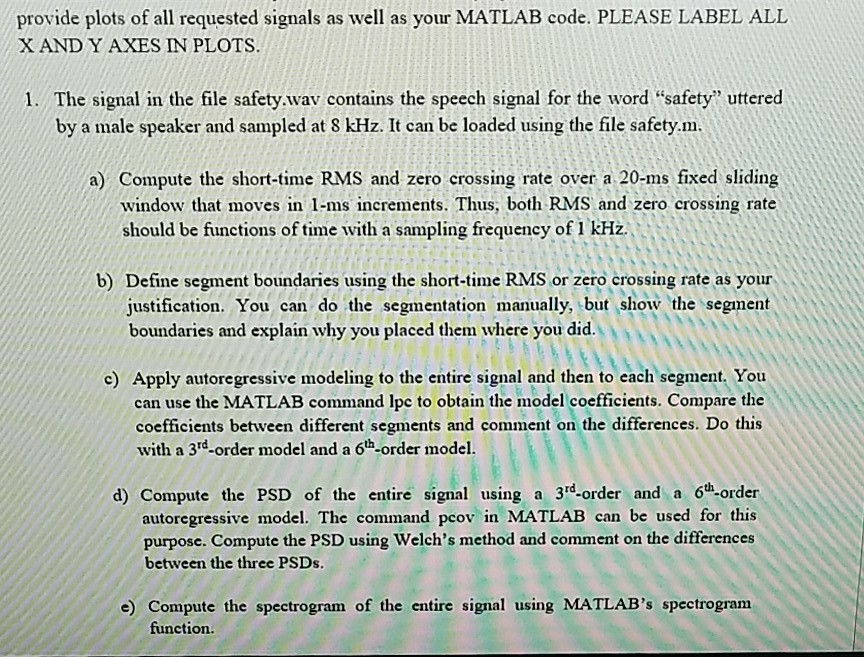
provide plots of all requested signals as well as your MATLAB code. PLEASE LABEL ALL X AND Y AXES IN PLOTS. 1. The signal in the file safety.wav contains the speech signal for the word "safety uttered by a male speaker and sampled at 8 kHz. It can be loaded using the file safety.m. a) Compute the short-time RMS and zero crossing rate over a 20-ms fixed sliding window that moves in 1-ms increments. Thus, both RMS and zero crossing rate should be functions of time with a sampling frequency of i kHz.? . b) Define segment boundaries using the short-time RMS or zero crossing rate as your justification. You can do the segmentation manually, but show the segment boundaries and explain why you placed them where you did. 946CC c) Apply autoregressive modeling to the entire signal and then to each segment, You can use the MATLAB command lpe to obtain the model coefficients. Compare the coefficients between different segments and comment on the differences. Do this with a 3rd-order model and a 6th-order model. d) Compute the PSD of the entire signal using a 3rd order and a 6h-order autoregressive model. The command pcov in MATLAB can be used for this purpose. Compute the PSD using Welch's method and comment on the differences between the three PSDs. e) Compute the spectrogram of the entire signal using MATLAB's spectrogram function. provide plots of all requested signals as well as your MATLAB code. PLEASE LABEL ALL X AND Y AXES IN PLOTS. 1. The signal in the file safety.wav contains the speech signal for the word "safety uttered by a male speaker and sampled at 8 kHz. It can be loaded using the file safety.m. a) Compute the short-time RMS and zero crossing rate over a 20-ms fixed sliding window that moves in 1-ms increments. Thus, both RMS and zero crossing rate should be functions of time with a sampling frequency of i kHz.? . b) Define segment boundaries using the short-time RMS or zero crossing rate as your justification. You can do the segmentation manually, but show the segment boundaries and explain why you placed them where you did. 946CC c) Apply autoregressive modeling to the entire signal and then to each segment, You can use the MATLAB command lpe to obtain the model coefficients. Compare the coefficients between different segments and comment on the differences. Do this with a 3rd-order model and a 6th-order model. d) Compute the PSD of the entire signal using a 3rd order and a 6h-order autoregressive model. The command pcov in MATLAB can be used for this purpose. Compute the PSD using Welch's method and comment on the differences between the three PSDs. e) Compute the spectrogram of the entire signal using MATLAB's spectrogram function
Step by Step Solution
There are 3 Steps involved in it
Step: 1

Get Instant Access to Expert-Tailored Solutions
See step-by-step solutions with expert insights and AI powered tools for academic success
Step: 2

Step: 3

Ace Your Homework with AI
Get the answers you need in no time with our AI-driven, step-by-step assistance
Get Started


