Pvalues/significance level/t test statistic
Show workout step by step with detailed explanation showing formula clearly where necessary
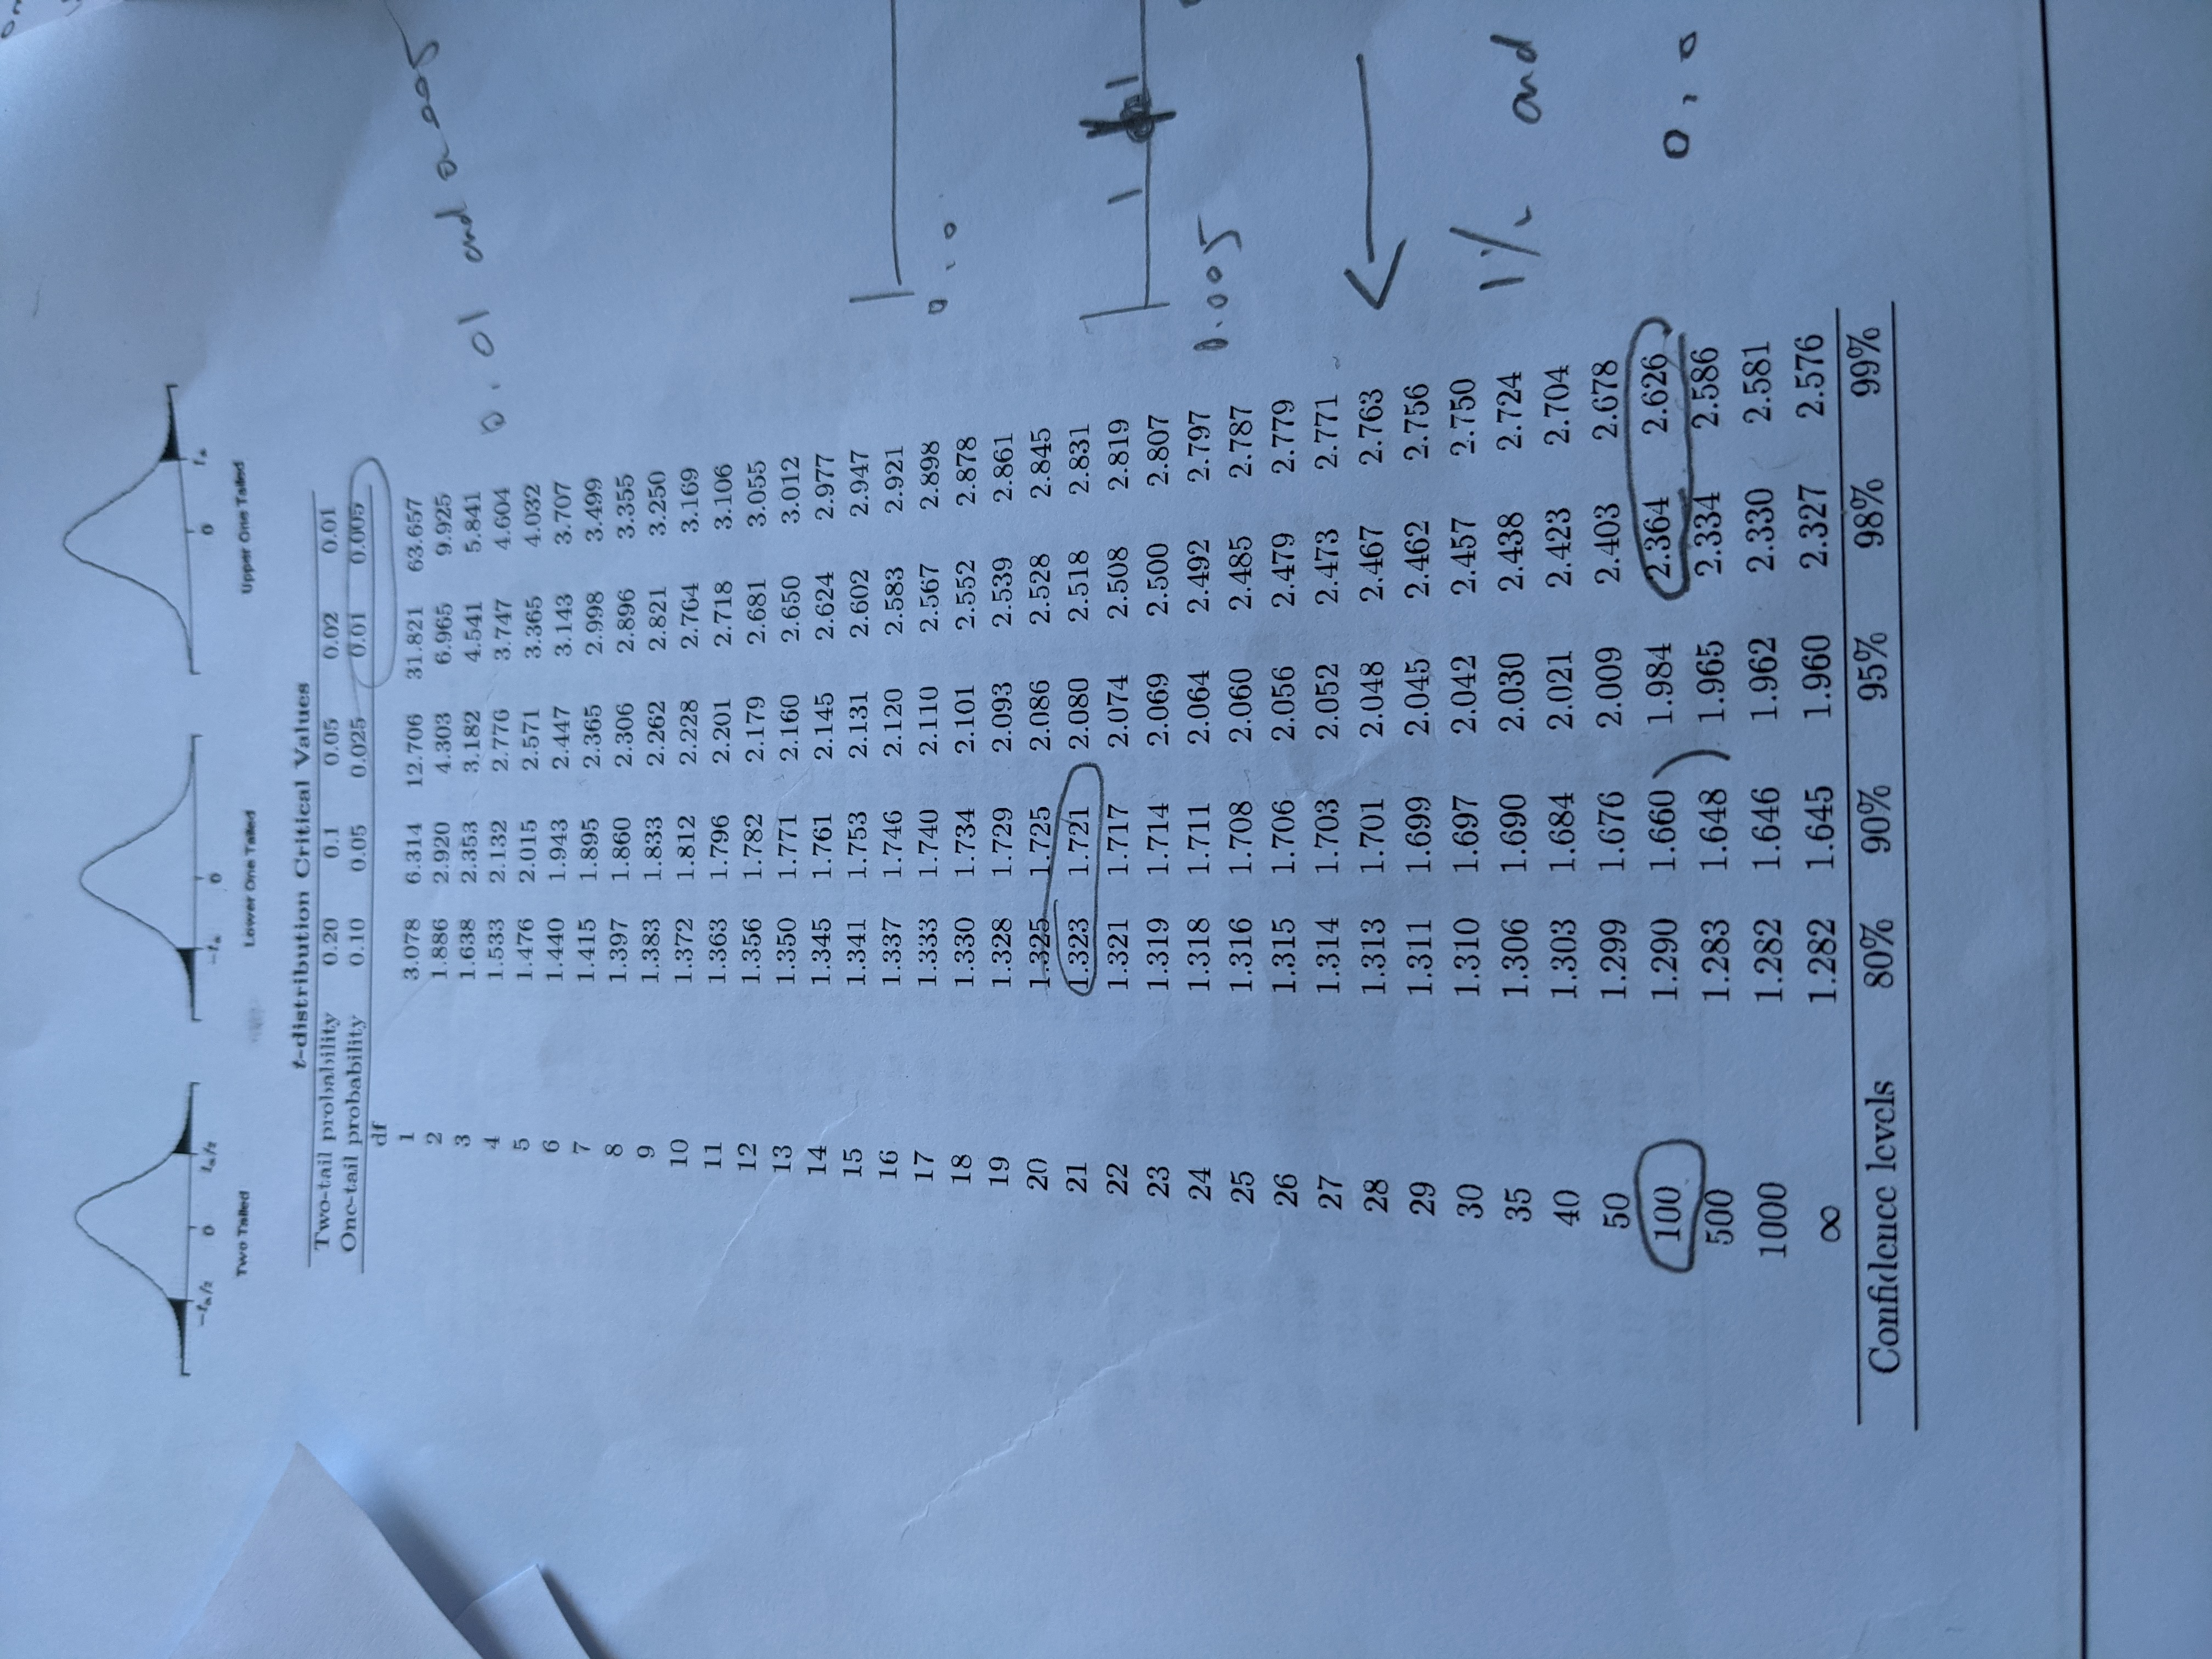
see 2 images,1 being statistical table. zoom in to see clearer. Please do (e)1,2 and (f)a,b
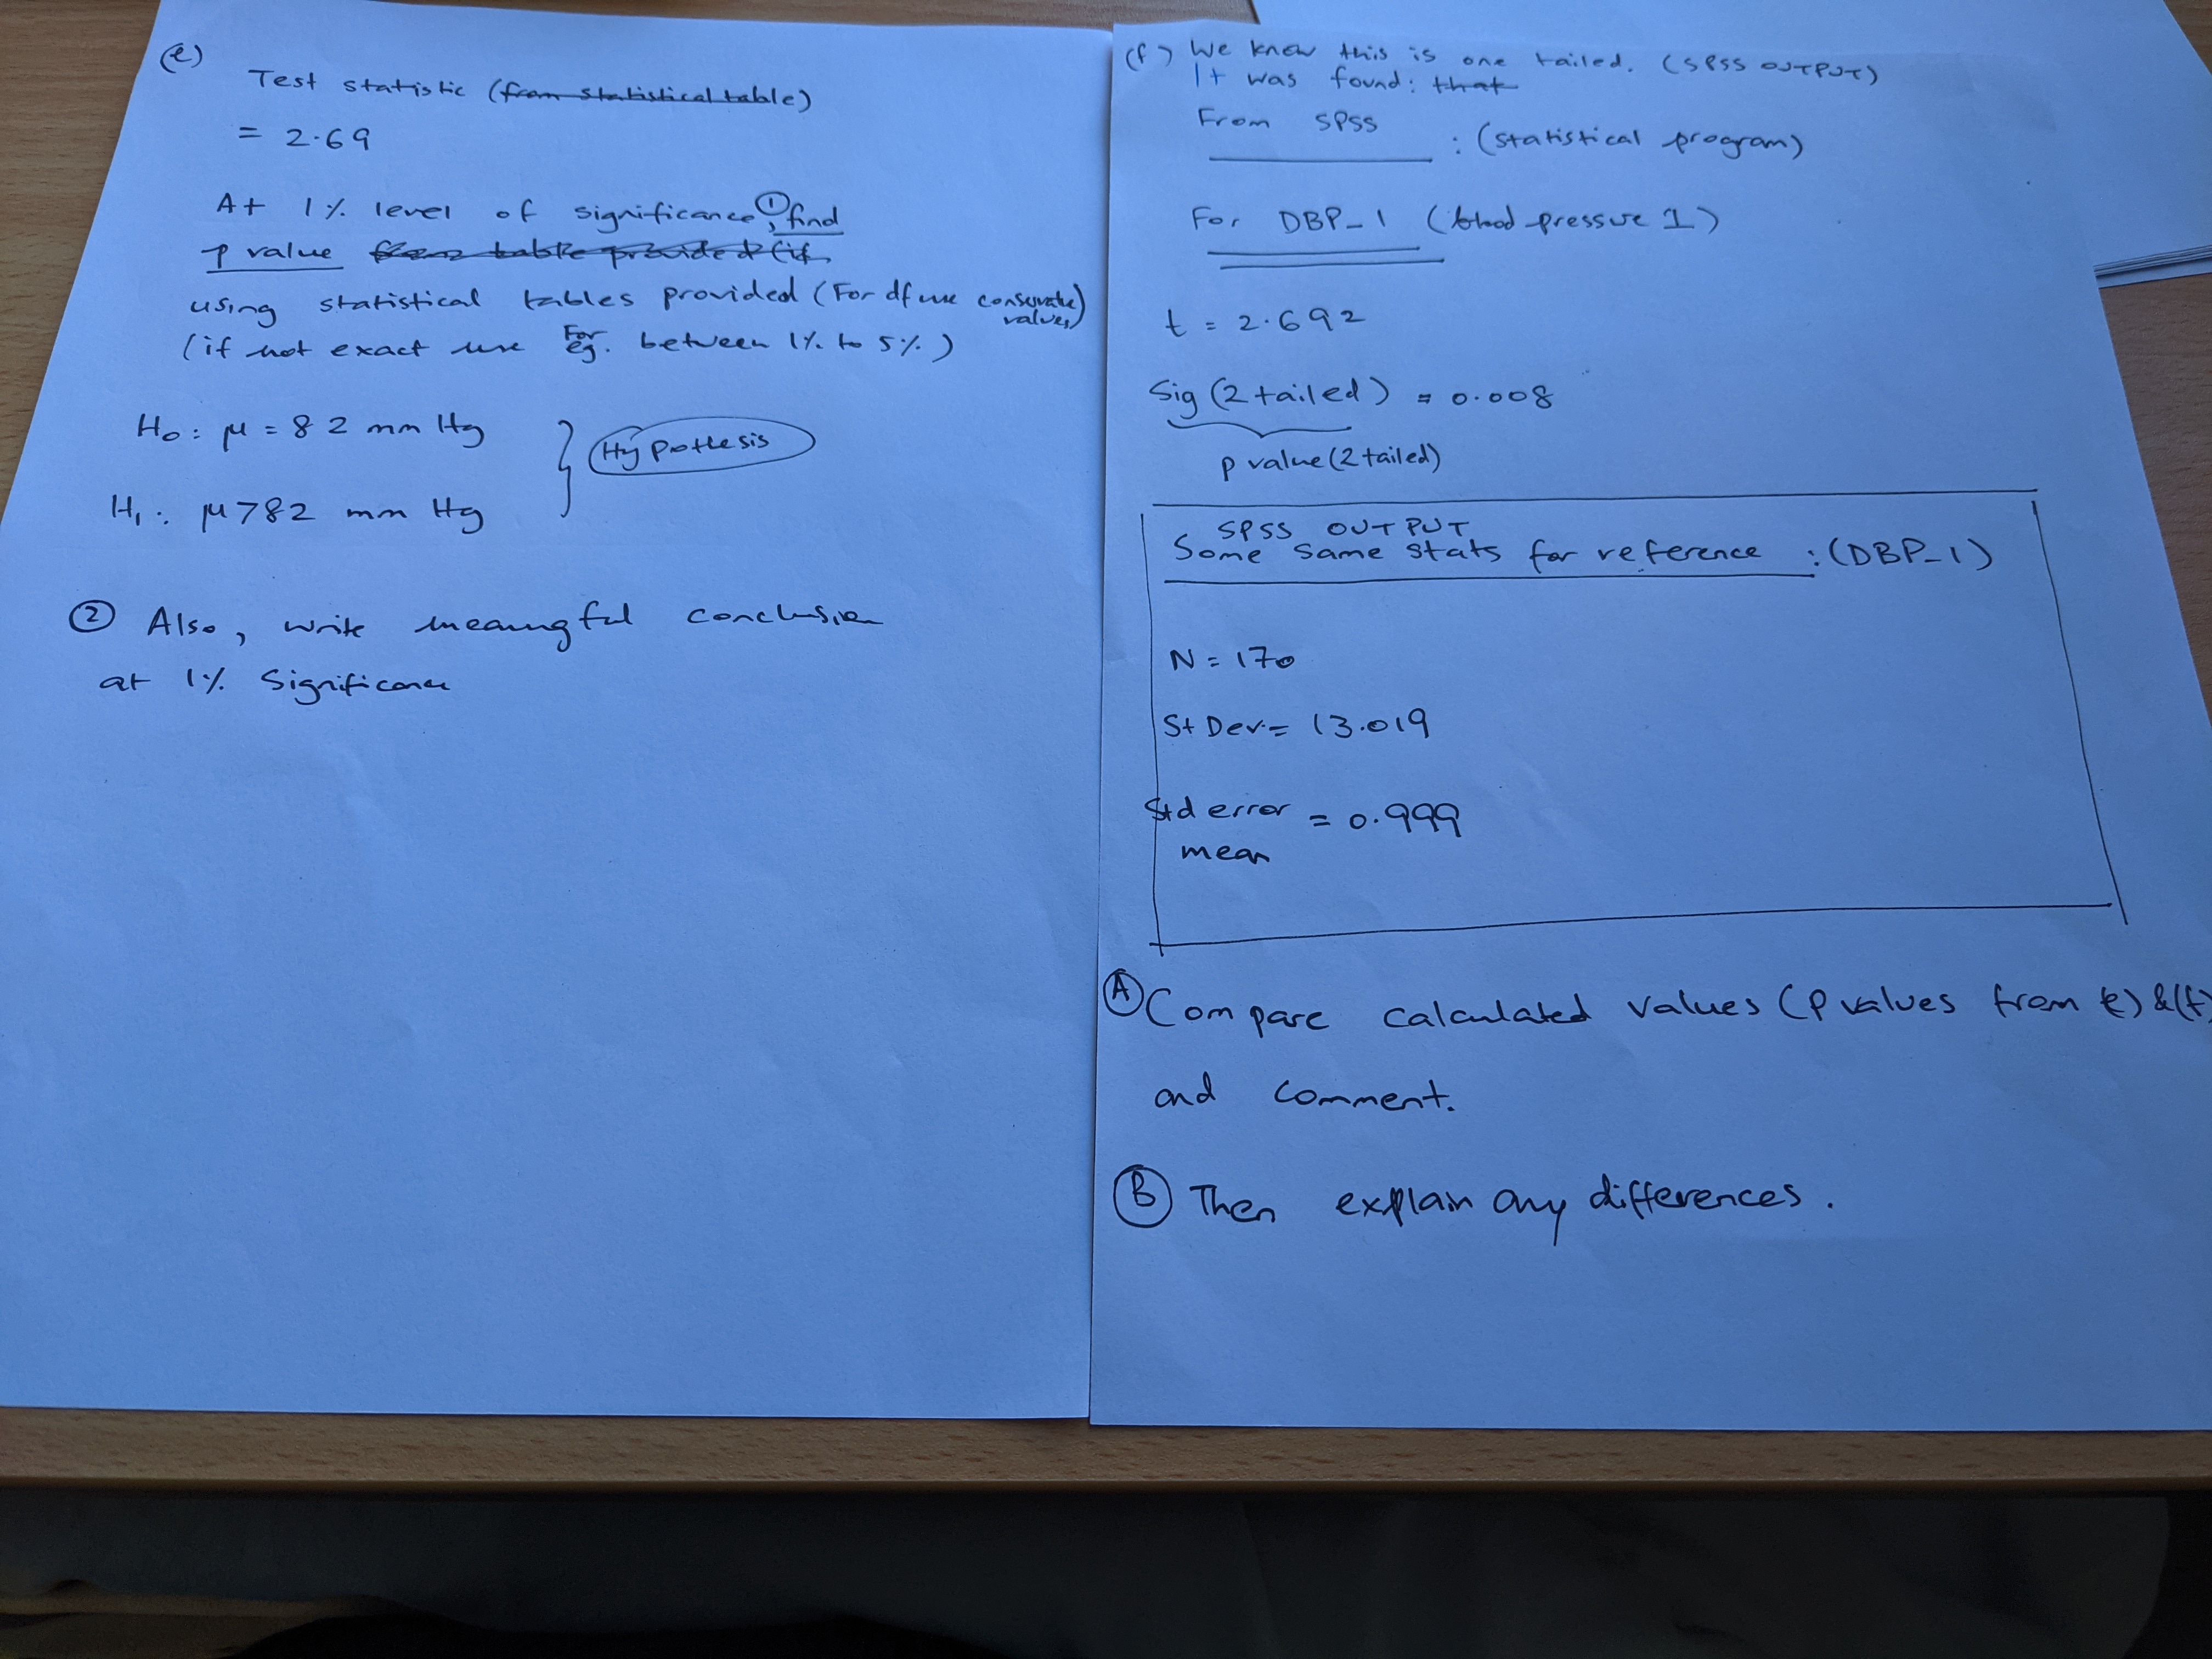
(e ) ( F ) L We know this is one tailed. (SPSS Output ) Test statistic ( from statistical table ) It was found : that = 2-69 From SPSS : ( statistical program ) At ly . level of significance , find For DBP- 1 (Ghod pressure (1) P value flan 2-talk presided fif , using statistical tables provided ( For dfone consuvate) values ) t = 2 . 692 ( if not exact me ey. between 19. to 5 % ) Sig ( 2 tailed ) = 0.008 Ho : 14 = 8 2 mm ly Hy Pothesis p value ( 2 tailed ) H,: 14782 mm Hy SPSS OUTPUT Some Same stats for reference : ( DB P- 1) 2) Also, write meaningful conclusion N = 170 at 14. Significance St Dev= 13.019 Std error = 0. 999 mean Compare calculated values (Pvalues from () &(f) and comment. B Then explain any differences.Two Talled Lower One Taked Upper One Talled t-distribution Critical Values Two-tail probability 0.20 0.1 0.05 0.02 0.01 One-tail probability 0.10 0.05 0.025 0.01 0.005 df 3.078 6.314 12.706 31.821 63.657 1.886 2.920 4.303 6.965 9.925 1.638 2.353 3.182 4.541 .. ol and on Dog 5.841 4 1.533 2.132 2.776 3.747 4.604 5 1.476 2.015 2.571 3.365 4.032 6 1.440 1.943 2.447 3.143 3.707 7 1.415 1.895 2.365 2.998 3.499 8 1.397 1.860 2.306 2.896 3.355 9 1.383 1.833 2.262 2.821 3.250 10 1.372 1.812 2.228 2.764 3.169 11 1.363 1.796 2.201 2.718 3.106 12 1.356 1.782 2.179 2.681 3.055 13 1.350 1.771 2.160 2.650 3.012 14 1.345 1.761 2.145 2.624 2.977 15 1.341 1.753 2.131 2.602 2.947 16 1.337 1.746 2.120 2.583 2.921 17 1.333 1.740 2.110 2.567 2.898 18 1.330 1.734 2.101 2.552 2.878 19 1.328 1.729 2.093 2.539 2.861 20 1.325 1.725 2.086 2.528 2.845 21 1.323 1.721 2.080 2.518 2.831 22 1.321 1.717 2.074 2.508 2.819 23 1.319 1.714 2.069 2.500 2.807 24 1.318 1.711 2.064 2.492 2.797 8.0 05 25 1.316 1.708 2.060 2.485 2.787 26 1.315 1.706 2.056 2.479 2.779 27 1.314 1.703 2.052 2.473 2.771 28 1.313 1.701 2.048 2.467 2.763 29 1.311 1.699 2.045 2.462 2.756 30 1.310 1.697 2.042 2.457 2.750 35 1.306 1.690 2.030 2.438 2.724 1/ and 40 1.303 1.684 2.021 2.423 2.704 50 1.299 1.676 2.009 2.403 2.678 100 1.290 1.660 1.984 2.364 2.626 500 1.283 1.648 1.965 2.334 2.586 1000 1.282 1.646 1.962 2.330 2.581 1.282 1.645 1.960 2.327 2.576 Confidence levels 80% 90% 95% 98% 99%