Question
python 3.6 I did: def build_empty_grid(height,width): xcoo = [] # to have each line for i in range(height): ycoo = [] # for number of
python 3.6
I did:
def build_empty_grid(height,width): xcoo = [] # to have each line for i in range(height): ycoo = [] # for number of elements in row for j in range(width): ycoo.append(False) xcoo.append(ycoo) return xcoo
def count_living(grid):
#Define value.
retVal=0
#For loop.
for k in range(len(grid)):
#For Loop.
for l in range(len(grid[k])):
#Check condition
if grid[k][l]==True:
#Update
retVal = retVal + 1
#Return
return retVal
def on_grid(grid, r, c):
#Get row length
rowLen=len(grid)
#Get column length
colLen=len(grid[0])
#Check condition.
if(r>=0 and c>=0):
#Check conditon.
if(r
#Return
return True
#Return
return False
I need:
1. read_coords
2.get_dimensions
3. build_grid
4.show_grid
5. any_living
6. count_neighbors
7. next_gen
8.n_gens
9. is_still_life
10. is_cycle
11. next_gen_growable
Thank in advance
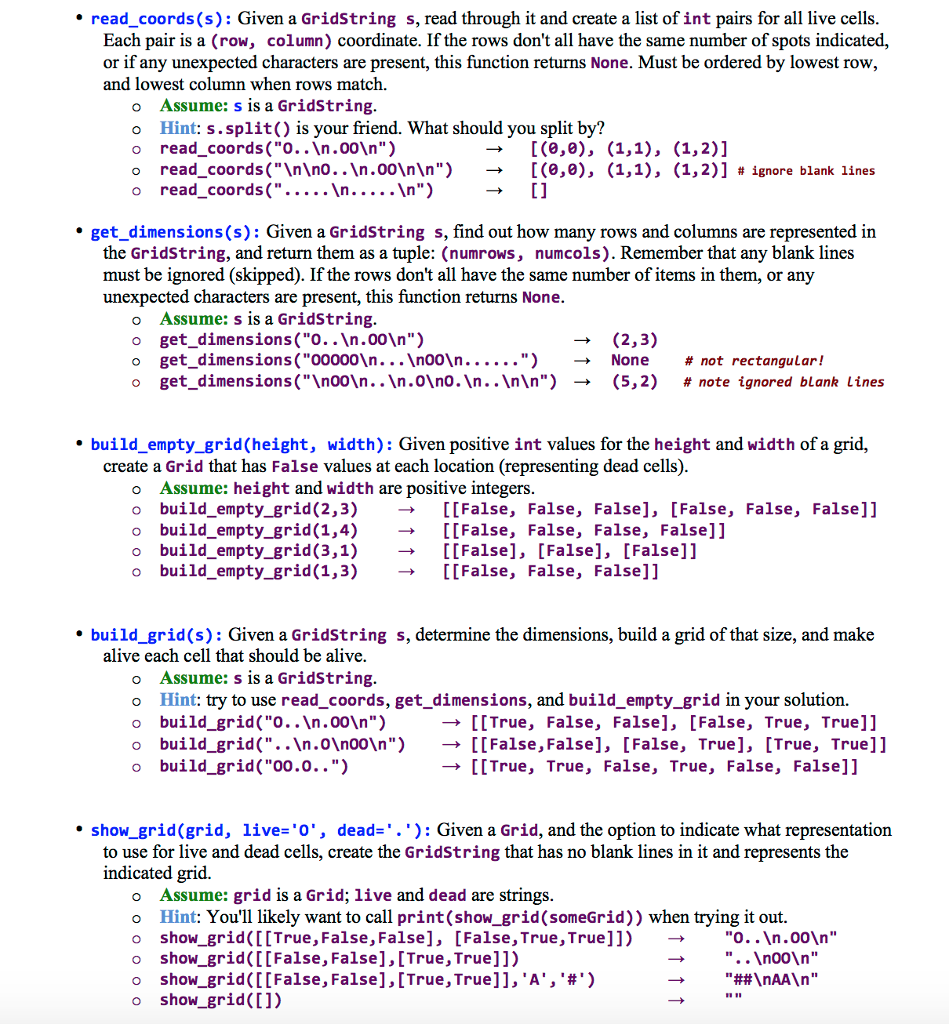
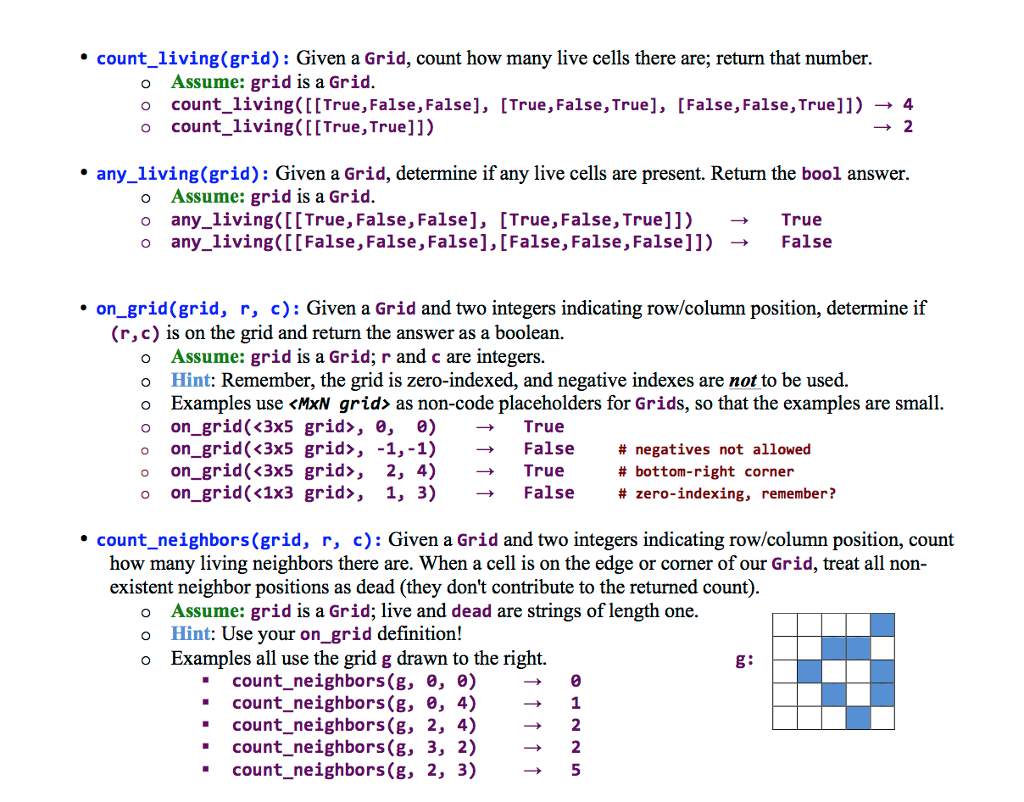
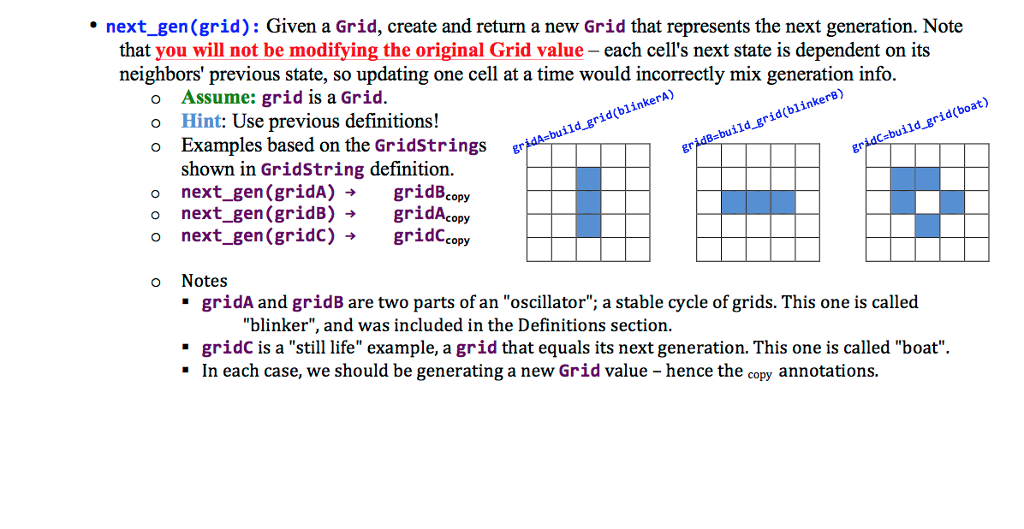
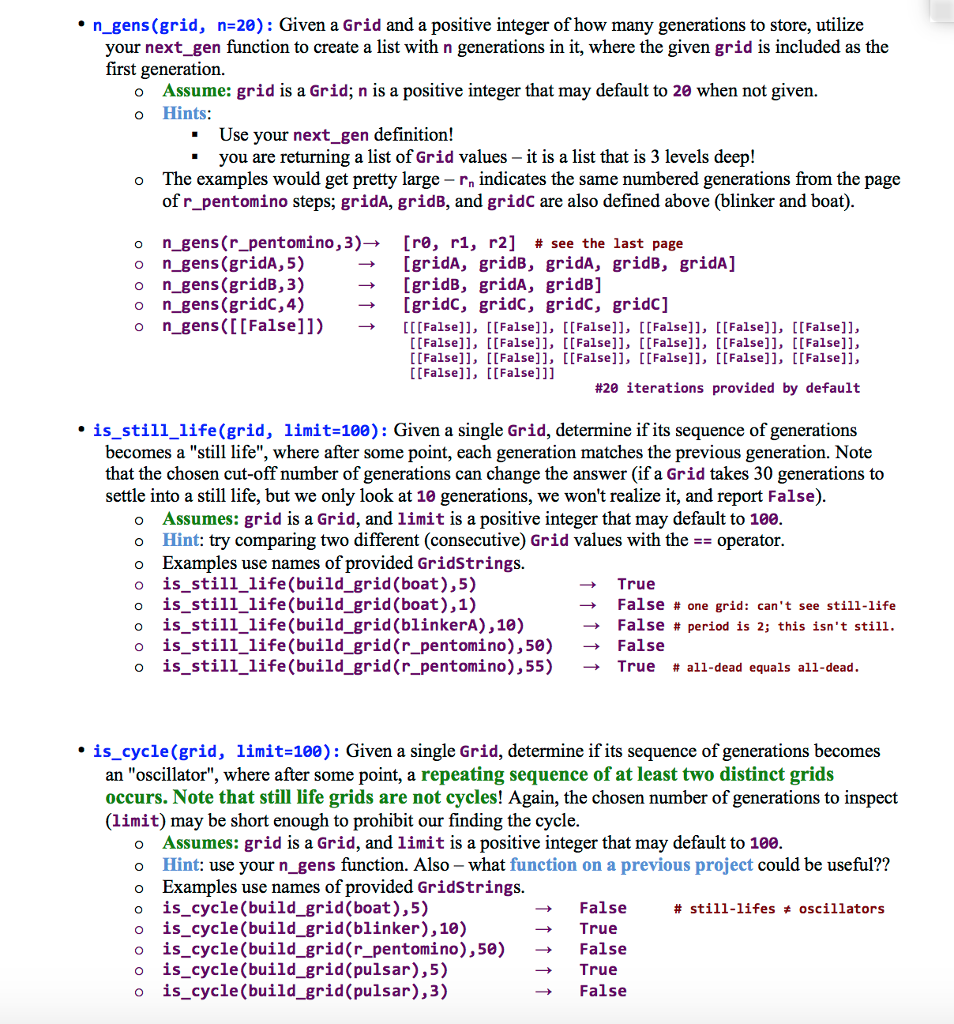
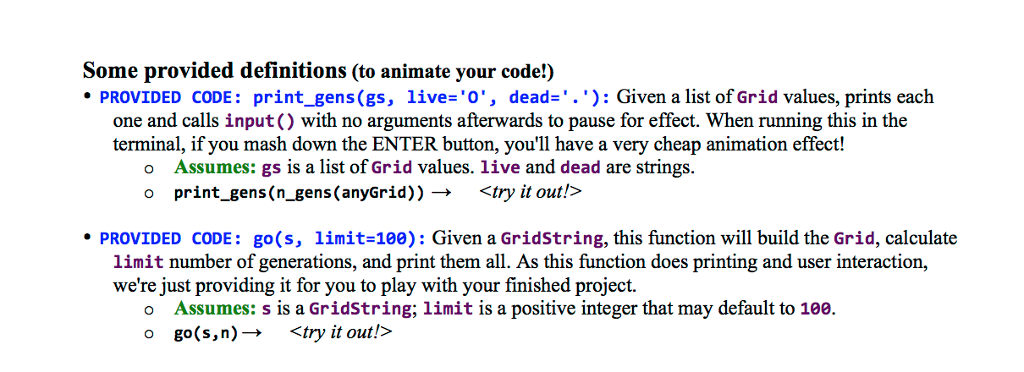
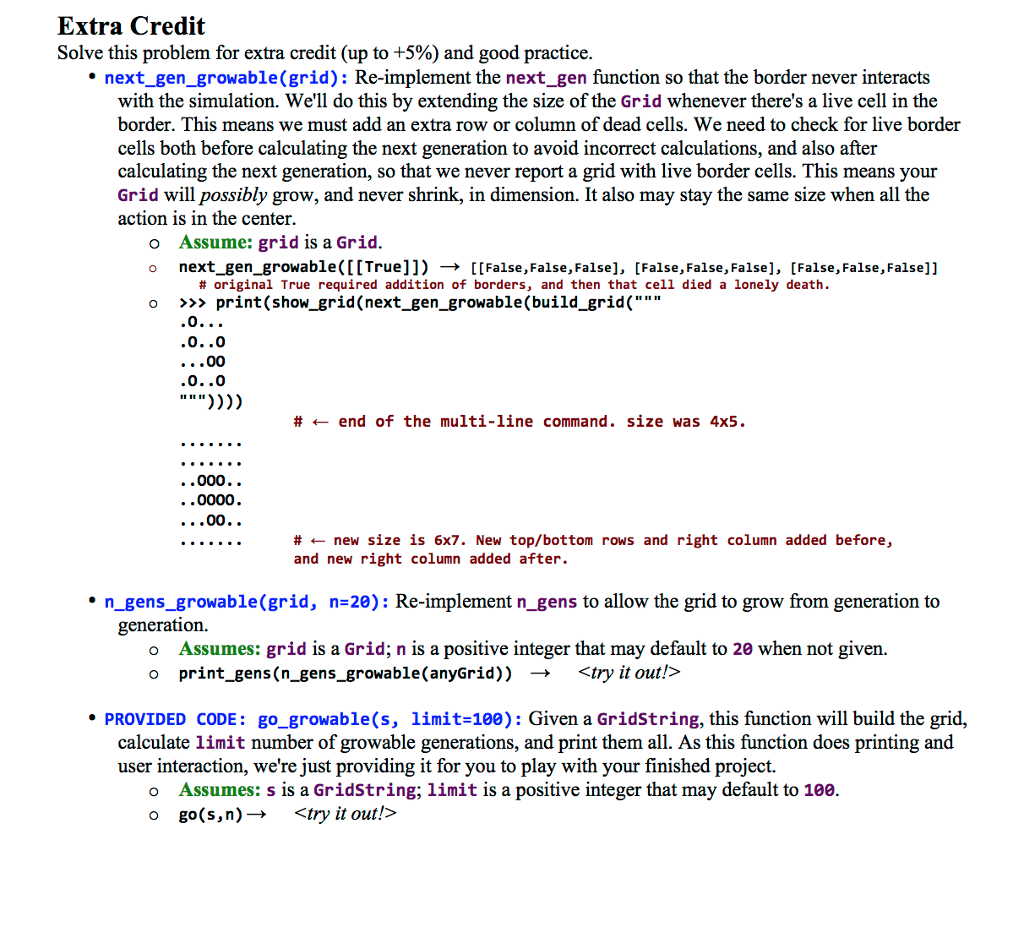
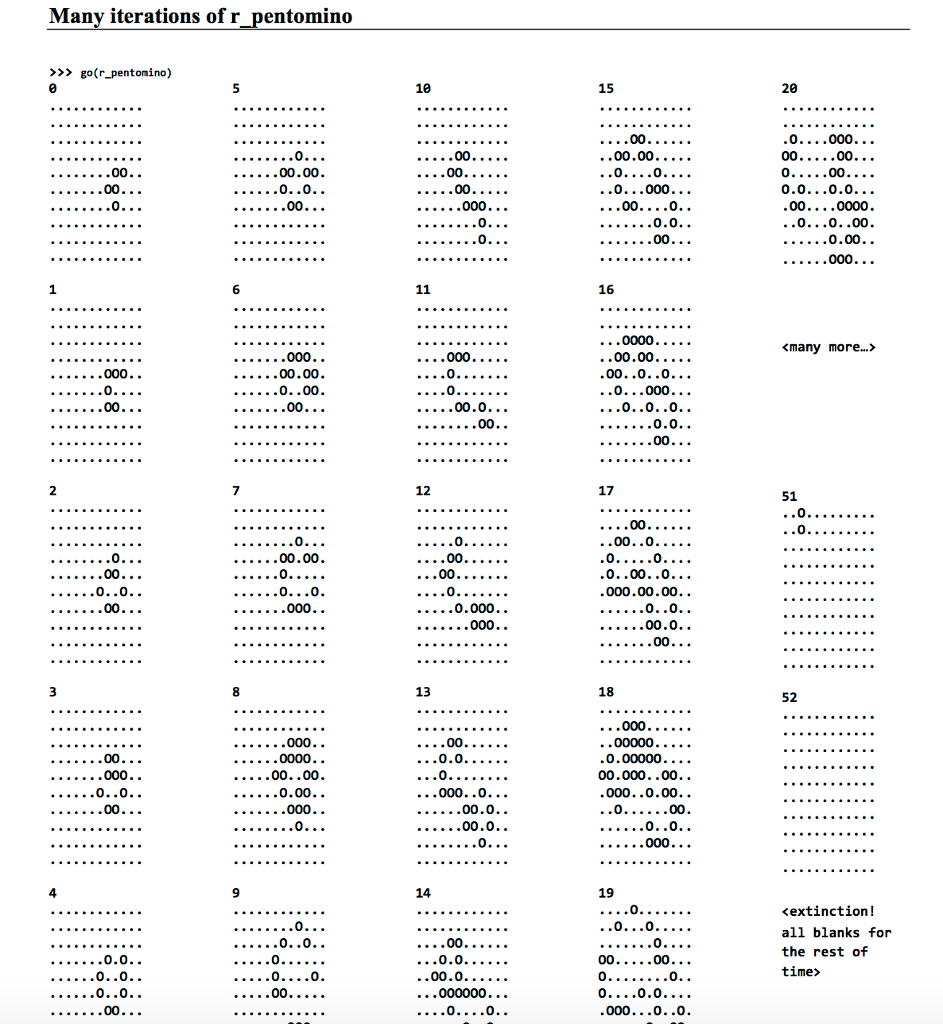
Read_coords(s): Given a GridString s, read through it and create a list of int pairs for all live cells. Each pair is a (row, column) coordinate. If the rows don't all have the same number of spots indicated, or if any unexpected characters are present, this function returns None. Must be ordered by lowest row, and lowest column when rows match, Assume: s is a GridString. get_dimensions(s): Given a GridString s, find out how many rows and columns are represented in the GridString, and return them as a tuple: (numrows, numcols). Remember that any blank lines must be ignored (skipped). If the rows don't all have the same number of items in them, or any unexpected characters are present, this function returns None. Assume: s is a GridString. get_dimensions("0.. .00 ") rightarrow (2, 3) get_dimensions("00000 .. 00 ......") rightarrow None get_dimensions(" 00 . .0 0. . ") rightarrow (5, 2) build_empty_grid(height, width): Given positive int values for the height and width of a grid, create a Grid that has False values at each location (representing dead cells). Assume: height and width are positive integers. build_empty_grid(2, 3) rightarrow [[False, False, False], [False, False, False]] build_empty_grid(1, 4) rightarrow [[False, False, False, False]] build_empty_grid(3, 1) rightarrow [[False], [False], [False]] build_empty_grid(1, 3) rightarrow [[False, False, False]] build_grid(s): Given a GridString s, determine the dimensions, build a grid of that size, and make alive each cell that should be alive. Assume: s is a GridString. show_grid(grid, live='0', dead='.'): Given a Grid, and the option to indicate what representation to use for live and dead cells, create the GridString that has no blank lines in it and represents the indicated grid. Assume: grid is a Grid: live and dead are strings. count_living(grid): Given a Grid, determine if any live cells are: return that number Assume: grid is a Grid. count_living ([[True, False, False], [True, False, True], [False, False, True]]) rightarrow 4 count_living ([[True, True]]) any_living (grid): Given a Grid, determine if any live cells are present. Return the bool answer. Assume: grid is a Grid. any_living([[True, False, False], [True, False, True]]) rightarrow True any_living([[False, False, False], [False, False, False]]) rightarrow False on_grid(grid, r, c): Given a Grid and two integers indicating row/column position, determine if (r, c) is on the grid and return the answer as a boolean. Assume: grid is a Grid: r and c are integers. count_neighbors(grid, r, c): Given a Grid and two integers indicating row/column position, count how many living neighbors there are. When a cell is on the edge or corner of our Grid, treat all nonexistent neighbor positions as dead (they don't contribute to the returned count). Assume: grid is a Grid: live and dead are strings of length one. next_gen(grid): Given a Grid, create and return a new Grid that represents the next generation. Note that you will not be modifying the original Grid value - each cell's next state is dependent on its neighbors' previous state, so updating one cell at a time would incorrectly mix generation info. Assume: grid is a Grid. n_gens(grid, n=20): Given a Grid and a positive integer of how many generations to store, utilize your next_gen function to create a list with n generations in it, where the given grid is included as the first generation. Assume: grid is a Grid: n is a positive integer that may default to 20 when not given. is_still_life(grid, limit=100): Given a single Grid, determine if its sequence of generations becomes a "still life", where after some point, each generation matches the previous generation. Assumes: grid is a Grid, and limit is a positive integer that may default to 100. is_cycle(grid, limit=100): Given a single Grid, determine if its sequence of generations becomes an "oscillator", where after some point, a repeating sequence of at least two distinct grids occurs. Assumes: grid is a Grid, and limit is a positive integer that may default to 100. Some provided definitions (to animate your code!) PROVIDED CODE: print_gens(gs, live='0', dead='.'): Given a list of Grid values, prints each one and calls input () with no arguments afterwards to pause for effect. When running this in the terminal, if you mash down the ENTER button, you'll have a very cheap animation effect! Assumes: gs is a list of Grid values, live and dead are strings. print_gens(n_gens(anyGrid)) rightarrow PROVIDED CODE: go(s, limit=100): Given a GridString, this function will build the Grid, calculate limit number of generations, and print them all. As this function does printing and user interaction, we're just providing it for you to play with your finished project. Assumes: s is a GridString: limit is a positive integer that may default to 100. go(S, n) rightarrow Many iterations of r_pentominoStep by Step Solution
There are 3 Steps involved in it
Step: 1

Get Instant Access to Expert-Tailored Solutions
See step-by-step solutions with expert insights and AI powered tools for academic success
Step: 2

Step: 3

Ace Your Homework with AI
Get the answers you need in no time with our AI-driven, step-by-step assistance
Get Started


