 (python)
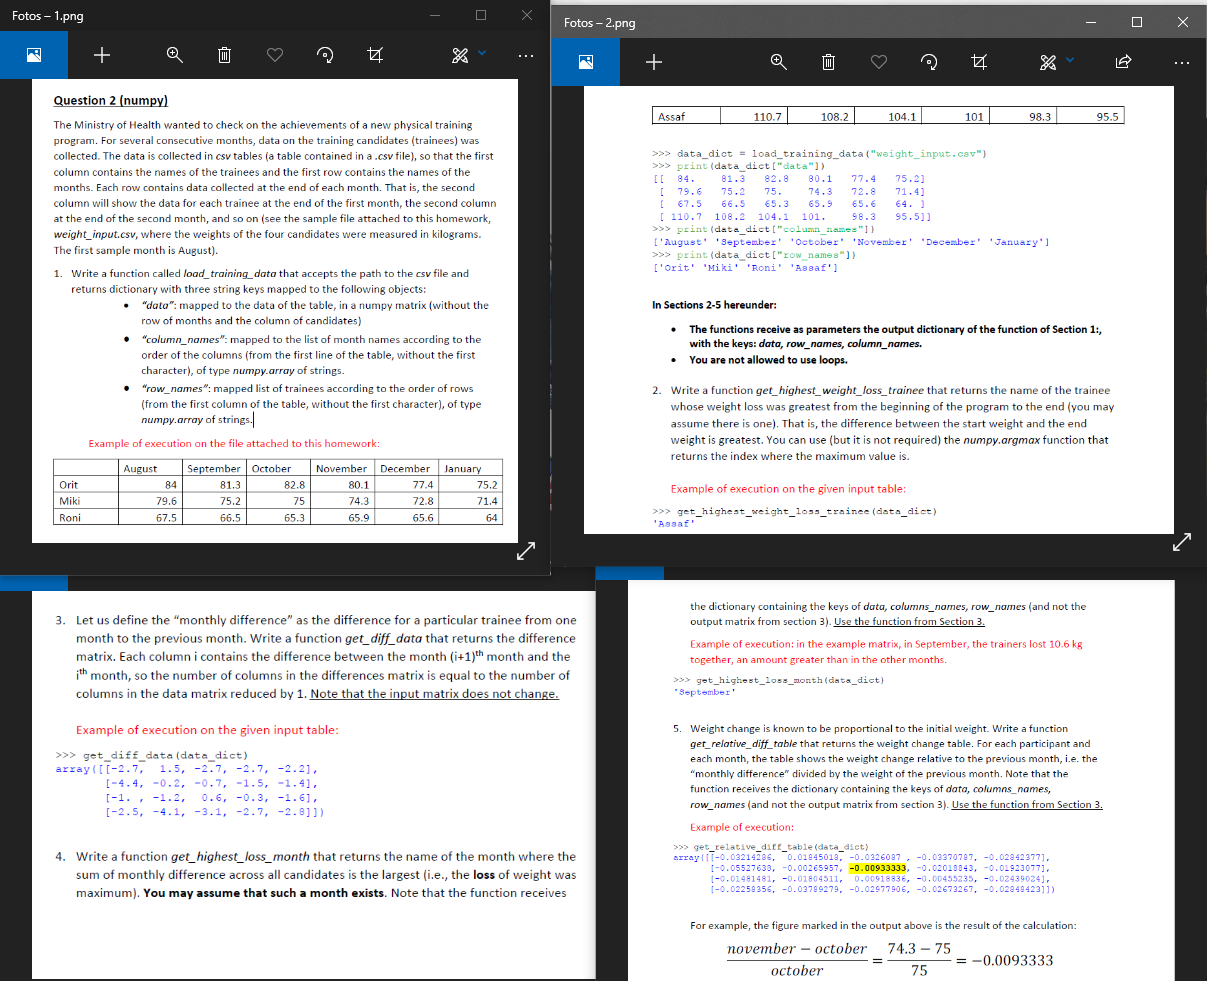
Fotos -1.png Fotos -2.png + + E Question 2 (numpy) Assaf 110.7 108.2 104.1 101 98,3 95.5 The Ministry of Health wanted to check on the achievements of a new physical training program. For several consecutive months, data on the training candidates (trainees) was collected. The data is collected in csv tables (a table contained in a .csv file), so that the first column contains the names of the trainees and the first row contains the names of the months. Each row contains data collected at the end of each month. That is, the second column will show the data for each trainee at the end of the first month, the second column at the end of the second month, and so on (see the sample file attached to this homework, weight_input.csv, where the weights of the four candidates were measured in kilograms. The first sample month is August). 1. Write a function called load_training_data that accepts the path to the csv file and returns dictionary with three string keys mapped to the following objects: "data": mapped to the data of the table, in a numpy matrix (without the row of months and the column of candidates) "column_names": mapped to the list of month names according to the order of the columns (from the first line of the table, without the first character), of type numpy.array of strings. "row_names": mapped list of trainees according to the order of rows (from the first column of the table, without the first character), of type numpy.array of strings. >>> data_dict = load_training_data("weight_input.cav") >>> print (data dict["data")) [[ 84. 81.3 82.8 80.1 77.4 75.2) [ 79.6 75.2 75. 74.3 72.8 71.4) [ 67.5 66.5 65.3 65.9 65.6 [ 110.7 108.2 104.1 101. 98.3 95.5)) >>> print (data dict("column_names"}} [ ['Augusti September October November December' 'January'] >>> print (data dict("row names"}} ['Orit' 'Miki' 'Roni' 'Asaf'] In Sections 2-5 hereunder: The functions receive as parameters the output dictionary of the function of Section 1:, with the keys: data, row_names, column_names. You are not allowed to use loops. 2. Write a function get_highest_weight_loss_trainee that returns the name of the trainee whose weight loss was greatest from the beginning of the program to the end (you may assume there is one). That is, the difference between the start weight and the end weight is greatest. You can use (but it is not required) the numpy.argmax function that returns the index where the maximum value is. Example of execution on the file attached to this homework: Orit Miki Roni August 84 79.6 67.5 September October 81.3 82.8 75 66.5 65.3 November 80.1 74.3 65.9 December 77.4 72.8 65.6 January 75.2 71.4 75.2 Example of execution on the given input table: >>>> get_highest_weight_loss_trainee (data_dict) 'Assaf 3. Let us define the "monthly difference" as the difference for a particular trainee from one month to the previous month. Write a function get_diff_data that returns the difference matrix. Each column i contains the difference between the month (i+1)th month and the ith month, so the number of columns in the differences matrix is equal to the number of columns in the data matrix reduced by 1. Note that the input matrix does not change. the dictionary containing the keys of data, columns_names, row_names (and not the output matrix from section 3). Use the function from Section 3. Example of execution: in the example matrix, in September, the trainers lost 10.6 kg together, an amount greater than in the other months. >>> get_highest_los_month(data_dict) September' Example of execution on the given input table: >>> get_diff_data (data_dict) array([[-2.7, 1.5, -2.7, -2.7, -2.2], [-4.4, -0.2, -0.7, -1.5, -1.4) [-1. , -1.2, 0.6, -0.3, -1.6), [-2.5, -4.1, -3.1, -2.7, -2.8]]) 5. Weight change is known to be proportional to the initial weight. Write a function get_relative_diff_table that returns the weight change table. For each participant and each month, the table shows the weight change relative to the previous month, i.e. the "monthly difference" divided by the weight of the previous month. Note that the function receives the dictionary containing the keys of data, columns_names, row_names (and not the output matrix from section 3). Use the function from Section 3. Example of execution: >>> get_relative_dit_table (data_dict) array|||-0.03214286, 0.01845013, -0.0326087, -0.02370787, -0.02842377), 1-0.05527638, -0.00265957, -0.00933333, -0.02010843, -0.01923077], (-0.01481481, -0.01804511, 0.00918836, -0.00455235, -0.02439024], 1-0.02258356,-0.03789279, -0.02977906, -0.02673267, -0.02848423]]) 4. Write a function get_highest_loss_month that returns the name of the month where the sum of monthly difference across all candidates is the largest (i.e., the loss of weight was maximum). You may assume that such a month exists. Note that the function receives For example, the figure marked in the output above is the result of the calculation: november - october 74.3 - 75 = -0.0093333 october 75 = Fotos -1.png Fotos -2.png + + E Question 2 (numpy) Assaf 110.7 108.2 104.1 101 98,3 95.5 The Ministry of Health wanted to check on the achievements of a new physical training program. For several consecutive months, data on the training candidates (trainees) was collected. The data is collected in csv tables (a table contained in a .csv file), so that the first column contains the names of the trainees and the first row contains the names of the months. Each row contains data collected at the end of each month. That is, the second column will show the data for each trainee at the end of the first month, the second column at the end of the second month, and so on (see the sample file attached to this homework, weight_input.csv, where the weights of the four candidates were measured in kilograms. The first sample month is August). 1. Write a function called load_training_data that accepts the path to the csv file and returns dictionary with three string keys mapped to the following objects: "data": mapped to the data of the table, in a numpy matrix (without the row of months and the column of candidates) "column_names": mapped to the list of month names according to the order of the columns (from the first line of the table, without the first character), of type numpy.array of strings. "row_names": mapped list of trainees according to the order of rows (from the first column of the table, without the first character), of type numpy.array of strings. >>> data_dict = load_training_data("weight_input.cav") >>> print (data dict["data")) [[ 84. 81.3 82.8 80.1 77.4 75.2) [ 79.6 75.2 75. 74.3 72.8 71.4) [ 67.5 66.5 65.3 65.9 65.6 [ 110.7 108.2 104.1 101. 98.3 95.5)) >>> print (data dict("column_names"}} [ ['Augusti September October November December' 'January'] >>> print (data dict("row names"}} ['Orit' 'Miki' 'Roni' 'Asaf'] In Sections 2-5 hereunder: The functions receive as parameters the output dictionary of the function of Section 1:, with the keys: data, row_names, column_names. You are not allowed to use loops. 2. Write a function get_highest_weight_loss_trainee that returns the name of the trainee whose weight loss was greatest from the beginning of the program to the end (you may assume there is one). That is, the difference between the start weight and the end weight is greatest. You can use (but it is not required) the numpy.argmax function that returns the index where the maximum value is. Example of execution on the file attached to this homework: Orit Miki Roni August 84 79.6 67.5 September October 81.3 82.8 75 66.5 65.3 November 80.1 74.3 65.9 December 77.4 72.8 65.6 January 75.2 71.4 75.2 Example of execution on the given input table: >>>> get_highest_weight_loss_trainee (data_dict) 'Assaf 3. Let us define the "monthly difference" as the difference for a particular trainee from one month to the previous month. Write a function get_diff_data that returns the difference matrix. Each column i contains the difference between the month (i+1)th month and the ith month, so the number of columns in the differences matrix is equal to the number of columns in the data matrix reduced by 1. Note that the input matrix does not change. the dictionary containing the keys of data, columns_names, row_names (and not the output matrix from section 3). Use the function from Section 3. Example of execution: in the example matrix, in September, the trainers lost 10.6 kg together, an amount greater than in the other months. >>> get_highest_los_month(data_dict) September' Example of execution on the given input table: >>> get_diff_data (data_dict) array([[-2.7, 1.5, -2.7, -2.7, -2.2], [-4.4, -0.2, -0.7, -1.5, -1.4) [-1. , -1.2, 0.6, -0.3, -1.6), [-2.5, -4.1, -3.1, -2.7, -2.8]]) 5. Weight change is known to be proportional to the initial weight. Write a function get_relative_diff_table that returns the weight change table. For each participant and each month, the table shows the weight change relative to the previous month, i.e. the "monthly difference" divided by the weight of the previous month. Note that the function receives the dictionary containing the keys of data, columns_names, row_names (and not the output matrix from section 3). Use the function from Section 3. Example of execution: >>> get_relative_dit_table (data_dict) array|||-0.03214286, 0.01845013, -0.0326087, -0.02370787, -0.02842377), 1-0.05527638, -0.00265957, -0.00933333, -0.02010843, -0.01923077], (-0.01481481, -0.01804511, 0.00918836, -0.00455235, -0.02439024], 1-0.02258356,-0.03789279, -0.02977906, -0.02673267, -0.02848423]]) 4. Write a function get_highest_loss_month that returns the name of the month where the sum of monthly difference across all candidates is the largest (i.e., the loss of weight was maximum). You may assume that such a month exists. Note that the function receives For example, the figure marked in the output above is the result of the calculation: november - october 74.3 - 75 = -0.0093333 october 75 =