

Question
Python language please. Thank you! #%% md # Setup First, let's import a few common modules, ensure MatplotLib plots figures inline and prepare a function
Python language please. Thank you!
#%% md # Setup First, let's import a few common modules, ensure MatplotLib plots figures inline and prepare a function to save the figures. We also check that Python 3.5 or later is installed (although Python 2.x may work, it is deprecated so we strongly recommend you use Python 3 instead), as well as Scikit-Learn 0.20. #%% # Python 3.5 is required import sys assert sys.version_info >= (3, 5) # Scikit-Learn 0.20 is required import sklearn assert sklearn.__version__ >= "0.20" # Common imports import numpy as np import os # to make this notebook's output stable across runs np.random.seed(42) # To plot pretty figures %matplotlib inline import matplotlib as mpl import matplotlib.pyplot as plt mpl.rc('axes', labelsize=14) mpl.rc('xtick', labelsize=12) mpl.rc('ytick', labelsize=12) # Where to save the figures PROJECT_ROOT_DIR = "." CHAPTER_ID = "training_linear_models" IMAGES_PATH = os.path.join(PROJECT_ROOT_DIR, "images", CHAPTER_ID) os.makedirs(IMAGES_PATH, exist_ok=True) def save_fig(fig_id, tight_layout=True, fig_extension="png", resolution=300): path = os.path.join(IMAGES_PATH, fig_id + "." + fig_extension) print("Saving figure", fig_id) if tight_layout: plt.tight_layout() plt.savefig(path, format=fig_extension, dpi=resolution) # Ignore useless warnings (see SciPy issue #5998) import warnings warnings.filterwarnings(action="ignore", message="^internal gelsd") #%% md # Linear regression using the Normal Equation #%% import numpy as np X = 2 * np.random.rand(100, 1) y = 4 + 3 * X + np.random.randn(100, 1) #%% plt.plot(X, y, "b.") plt.xlabel("$x_1$", fontsize=18) plt.ylabel("$y$", rotation=0, fontsize=18) plt.axis([0, 2, 0, 15]) save_fig("generated_data_plot") plt.show() #%% X_b = np.c_[np.ones((100, 1)), X] # add x0 = 1 to each instance theta_best = np.linalg.inv(X_b.T.dot(X_b)).dot(X_b.T).dot(y) #%% theta_best #%% X_new = np.array([[0], [2]]) X_new_b = np.c_[np.ones((2, 1)), X_new] # add x0 = 1 to each instance y_predict = X_new_b.dot(theta_best) y_predict #%% plt.plot(X_new, y_predict, "r-") plt.plot(X, y, "b.") plt.axis([0, 2, 0, 15]) plt.show() #%% md adding labels and legend to the plot #%% plt.plot(X_new, y_predict, "r-", linewidth=2, label="Predictions") plt.plot(X, y, "b.") plt.xlabel("$x_1$", fontsize=18) plt.ylabel("$y$", rotation=0, fontsize=18) plt.legend(loc="upper left", fontsize=14) plt.axis([0, 2, 0, 15]) save_fig("linear_model_predictions_plot") plt.show() #%% md # sklearn models #%% from sklearn.linear_model import LinearRegression lin_reg = LinearRegression() lin_reg.fit(X, y) lin_reg.intercept_, lin_reg.coef_ #%% lin_reg.predict(X_new) #%% md The LinearRegression class is based on the scipy.linalg.lstsq() function (the name stands for "least squares"), which you could call directly: #%% theta_best_svd, residuals, rank, s = np.linalg.lstsq(X_b, y, rcond=1e-6) theta_best_svd #%% md This function computes $\mathbf{X}^+\mathbf{y}$, where $\mathbf{X}^{+}$ is the pseudoinverse of $\mathbf{X}$ (specifically the Moore-Penrose inverse). You can use np.linalg.pinv() to compute the pseudoinverse directly: #%% md # Linear regression using batch gradient descent #%% md # a [6 Marks] Write a simple implementation of a least-squares solution to linear regression that applies an iterative update to adjust the weights. Demonstrate the success of your approach on the sample data loaded below, and visualize the best fit plotted as a line (consider using linspace) against a scatter plot of the x and y test values #%% ##### YOUR CODE HERE ####### #%% md # b [6 Marks] Load data on movie ratings, revenue, metadata etc. Split data into a relevant set for training, testing and classification. Explain your choice of split. It is ok if you decide to split into these subsets after part c -> if you do so, mention this at the end of your explanation. Explanation: #%% ### An example to load a csv file import pandas as pd import numpy as np from ast import literal_eval meta_data=pd.read_csv('movies_metadata.csv', low_memory=False) # You may wish to specify types, or process columns once read ratings_small=pd.read_csv('ratings_small.csv') import warnings; warnings.simplefilter('ignore') ##### YOUR CODE HERE ####### #%% #%% md # c [6 Marks] #%% md Organize the data into relevant features for predicting revenue. i. Explain your feature sets and organization. YOUR EXPLANATION HERE ii. Plot movie revenue vs. rating as a scatter plot and discuss your findings. YOUR EXPLANATION HERE iii. Visualize any other relationships you deem interesting and explain. YOUR EXPLANATION HERE #%% meta_data.head(10) # The following line is one way of cleaning up the genres field - there are more verbose ways of doing this that are easier for a human to read #meta_data['genres'] = meta_data['genres'].fillna('[]').apply(literal_eval).apply(lambda x: [i['name'] for i in x] if isinstance(x, list) else []) #meta_data['year'] = pd.to_datetime(meta_data['release_date'], errors='coerce').apply(lambda x: str(x).split('-')[0] if x != np.nan else np.nan) meta_data.head() # Consider how to columns look before and after this 'clean-up' - it is very common to have to massage the data to get the right features #ratings_small.head() ##### YOUR CODE HERE #######
logistics_x.txt
1.343250400 -1.331147900 1.820552900 -0.634668100 0.986320670 -1.888576200 1.94E+00 -1.64E+00 9.77E-01 -1.35E+00 1.945858400 -2.044327800 2.11E+00 -2.125668400 2.07E+00 -2.46E+00 8.69E-01 -2.41E+00 1.80E+00 -2.77E+00 3.13E+00 -3.445243200 3.09E+00 -3.644614500 2.91E+00 -4.006503700 2.68E+00 -3.019859200 2.75E+00 -2.710056100 4.17E+00 -3.462248200 3.93E+00 -2.109904400 4.38E+00 -2.380474300 4.80E+00 -3.380334400 4.17E+00 -2.813884400 2.47E+00 -1.610844400 3.48E+00 -1.553387200 3.37E+00 -1.816493600 2.88E+00 -1.851168900 3.11E+00 -1.638494600 2.22E+00 0.074279558 1.99E+00 0.162686590 2.95E+00 0.016873016 2.02E+00 0.172273870 2.05E+00 -0.635810410 8.75E-01 -0.545861680 5.71E-01 -0.033278660 1.43E+00 -0.752883370 7.23E-01 -0.866919300 9.53E-01 -1.489695600 4.83E+00 0.070175439 4.31E+00 1.415204700 6.03E+00 0.450292400 5.42E+00 -2.707602300 3.46E+00 -2.824561400 2.73E+00 -0.923976610 1.00E+00 0.771929820 3.66E+00 -0.777777780 4.31E+00 -1.040935700 3.69E+00 -0.105263160 5.74E+00 -1.625731000 4.98E+00 -1.508771900 6.50E+00 -2.912280700 5.24E+00 0.918128650 1.68E+00 0.567251460 5.17E+00 1.210366700 4.88E+00 1.608184800 4.66E+00 1.069553200 4.49E+00 1.235159200 4.15E+00 0.867212600 3.72E+00 1.151720000 3.62E+00 1.310676900 3.06E+00 1.485716300 7.07E+00 -0.349616510 6.04E+00 -0.247568320 6.67E+00 -0.124847660 6.85E+00 0.259771670 6.43E+00 -0.147138630 6.85E+00 1.475496700 7.71E+00 1.604555500 6.29E+00 2.415642700 6.98E+00 1.259986500 7.10E+00 2.215515100 5.53E+00 0.299684210 5.83E+00 -0.219744080 6.36E+00 0.239442170 6.10E+00 -0.040957414 5.62E+00 0.371359140 5.88E+00 2.776818600 5.58E+00 3.068288900 7.01E+00 -0.257817270 4.45E+00 0.839418310 5.65E+00 1.305392900 4.63E+00 1.946754600 3.70E+00 2.259408400 4.12E+00 2.547451000 4.77E+00 2.753120900 3.08E+00 2.798525500 4.07E+00 -3.029239800 3.49E+00 -1.888888900 7.69E-01 1.210526300 1.50E+00 3.812865500 5.80E+00 -2.093567300 6.81E+00 -0.834567300 7.11E+00 -1.020115800 7.49E+00 -1.742690100 3.14E+00 0.421052630 1.68E+00 0.508771930 2.49E+00 -0.865497080 4.77E+00 0.099415205 5.83E+00 -0.690058480 2.29E+00 1.970760200 2.49E+00 1.415204700 2.08E+00 1.356725100
logistics_y.txt
-1 -1 -1 -1 -1 -1 -1 -1 -1 -1 -1 -1 -1 -1 -1 -1 -1 -1 -1 -1 -1 -1 -1 -1 -1 -1 -1 -1 -1 -1 -1 -1 -1 -1 -1 -1 -1 -1 -1 -1 -1 -1 -1 -1 -1 -1 -1 -1 -1 1 1 1 1 1 1 1 1 1 1 1 1 1 1 1 1 1 1 1 1 1 1 1 1 1 1 1 1 1 1 1 1 1 1 1 1 1 1 1 1 1 1 1 1 1 1 1 1 1 1
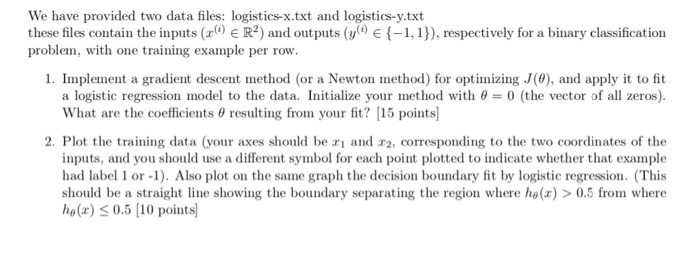
We have provided two data files: logistics-x.txt and logistics-y.txt these files contain the inputs (0) ER) and outputs (y) {-1,1}), respectively for a binary classification problem, with one training example per row. 1. Implement a gradient descent method (or a Newton method) for optimizing JO), and apply it to fit a logistic regression model to the data. Initialize your method with 0 = 0 (the vector of all zeros). What are the coefficients resulting from your fit? (15 points) 2. Plot the training data (your axes should be ti and 2, corresponding to the two coordinates of the inputs, and you should use a different symbol for each point plotted to indicate whether that example had label 1 or -1). Also plot on the same graph the decision boundary fit by logistic regression. (This should be a straight line showing the boundary separating the region where he (2) > 0.5 from where ho.) 0.5 from where ho.)
Step by Step Solution
There are 3 Steps involved in it
Step: 1

Get Instant Access to Expert-Tailored Solutions
See step-by-step solutions with expert insights and AI powered tools for academic success
Step: 2

Step: 3
Ace Your Homework with AI
Get the answers you need in no time with our AI-driven, step-by-step assistance
Get Started
Databases In Networked Information Systems 6th International Workshop Dnis 2010 Aizu Wakamatsu Japan March 2010 Proceedings Lncs 5999
Authors: Shinji Kikuchi ,Shelly Sachdeva ,Subhash Bhalla
2010th Edition
3642120377, 978-3642120374