

Question: Python problem. Please help me. Thank you! the output would be like this: Part 3: Modeling Conway's Game of Life Conway's Game of Life is
Python problem.
Please help me. Thank you!
the output would be like this:
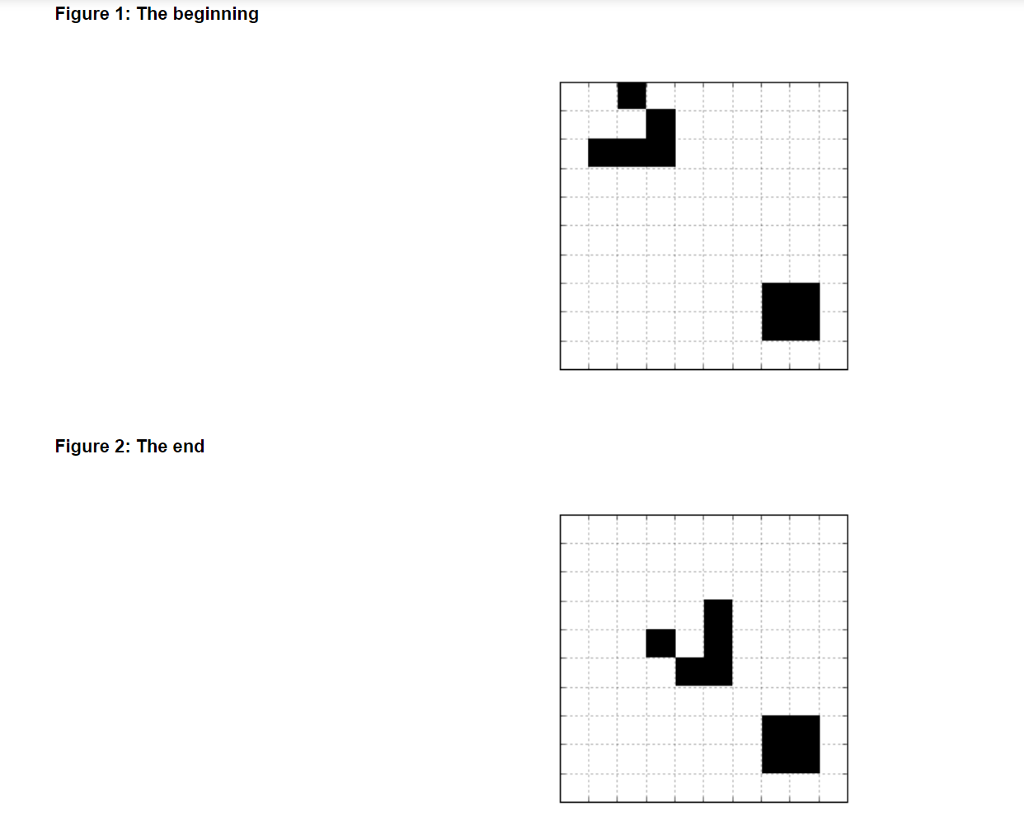
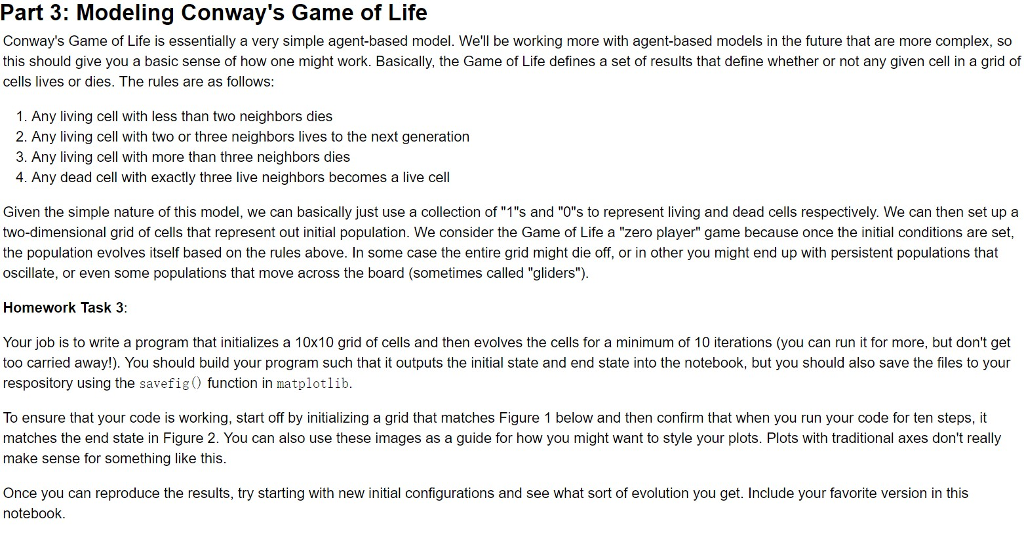
Part 3: Modeling Conway's Game of Life Conway's Game of Life is essentially a very simple agent-based model. We'll be working more with agent-based models in the future that are more complex, so this should give you a basic sense of how one might work. Basically, the Game of Life defines a set of results that define whether or not any given cell in a grid of cells lives or dies. The rules are as follows: 1. Any living cell with less than two neighbors dies 2. Any living cell with two or three neighbors lives to the next generation 3. Any living cell with more than three neighbors dies 4. Any dead cell with exactly three live neighbors becomes a live cell Given the simple nature of this model, we can basically just use a collection of "1"'s and "O"s to represent living and dead cells respectively. We can then set up a two-dimensional grid of cells that represent out initial population. We consider the Game of Life a "zero player" game because once the initial conditions are set, the population evolves itself based on the rules above. In some case the entire grid might die off, or in other you might end up with persistent populations that oscillate, or even some populations that move across the board (sometimes called "gliders") Homework Task 3 Your job is to write a program that initializes a 10x10 grid of cells and then evolves the cells for a minimum of 10 iterations (you can run it for more, but don't get too carried away!). You should build your program such that it outputs the initial state and end state into the notebook, but you should also save the files to your respository using the savefigO function in matplotlib To ensure that your code is working, start off by initializing a grid that matches Figure 1 below and then confirm that when you run your code for ten steps, it matches the end state in Figure 2. You can also use these images as a guide for how you might want to style your plots. Plots with traditional axes don't really make sense for something like this Once you can reproduce the results, try starting with new initial configurations and see what sort of evolution you get. Include your favorite version in this notebook
Step by Step Solution
There are 3 Steps involved in it

Get step-by-step solutions from verified subject matter experts