Answered step by step
Verified Expert Solution
Question
1 Approved Answer
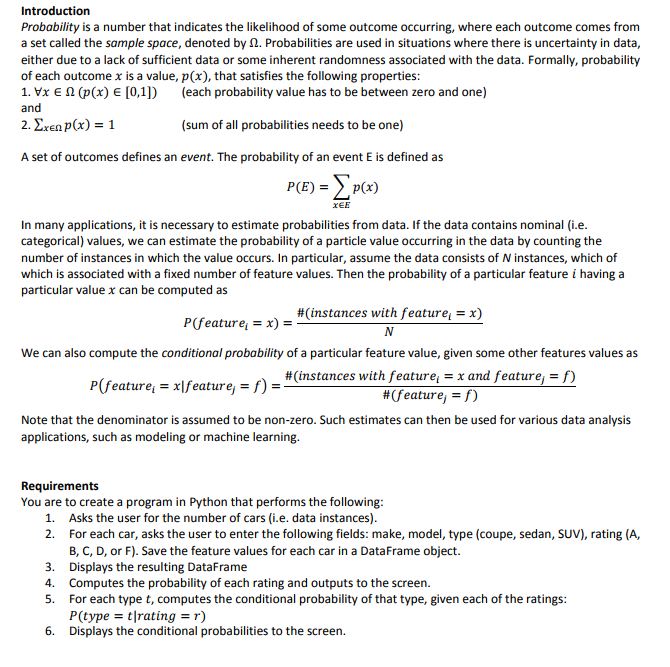
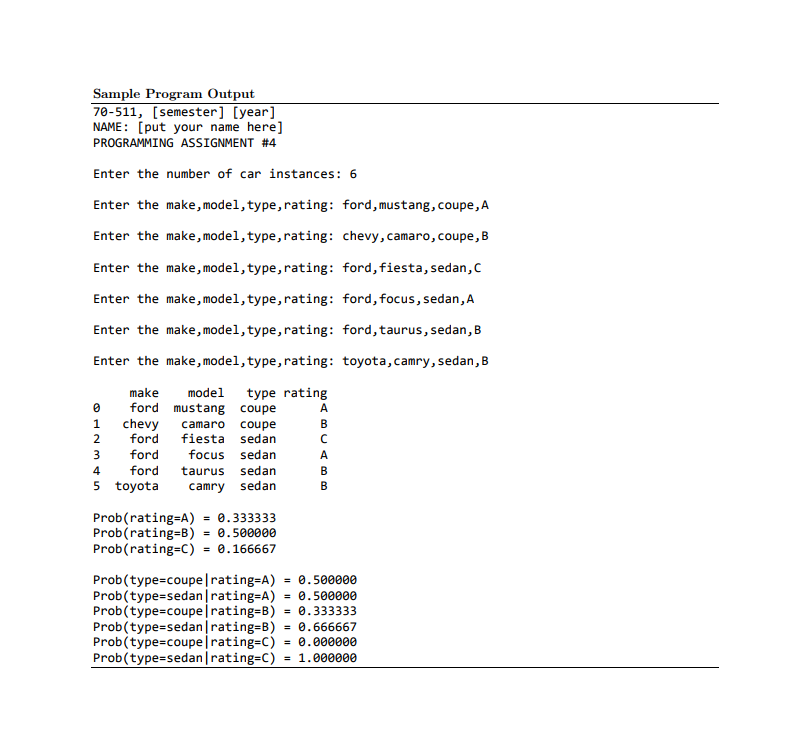
Python Programming for Estimating Probabilities using pandas DataFrame The output should be exact like the above. Introduction Probability is a number that indicates the likelihood
Python Programming for Estimating Probabilities using pandas DataFrame


The output should be exact like the above.
Introduction Probability is a number that indicates the likelihood of some outcome occurring, where each outcome comes from a set called the sample space, denoted by . Probabilities are used in situations where there is uncertainty in data either due to a lack of sufficient data or some inherent randomness associated with the data. Formally, probability of each outcome x is a value, p(x), that satisfies the following properties: 1br E (p(x) E [0,1]) (each probability value has to be between zero and one) and (sum of all probabilities needs to be one) A set of outcomes defines an event. The probability of an event E is defined as P(E) = p(x) XEE In many applications, it is necessary to estimate probabilities from data. If the data contains nominal (i.e categorical) values, we can estimate the probability of a particle value occurring in the data by counting the number of instances in which the value occurs. In particular, assume the data consists of N instances, which of which is associated with a fixed number of feature values. Then the probability of a particular feature i having a particular value x can be computed as #(instances with feature,-x) P(feature,-x) = We can also compute the conditional probability of a particular feature value, given some other features values as instances with feature,-x and feature, = f) #(feature.=f) P(feature, = feature,-/) = Note that the denominator is assumed to be non-zero. Such estimates can then be used for various data analysis applications, such as modeling or machine learning. Requirements You are to create a program in Python that performs the following 1. Asks the user for the number of cars (i.e. data instances) 2. For each car, asks the user to enter the following fields: make, model, type (coupe, sedan, SUV), rating (A, B, C, D, or F). Save the feature values for each car in a DataFrame object. Displays the resulting DataFrame Computes the probability of each rating and outputs to the screen. For each type t, computes the conditional probability of that type, given each of the ratings P(type = trating = r) Displays the conditional probabilities to the screen. 3. 4. 5. 6
Step by Step Solution
There are 3 Steps involved in it
Step: 1

Get Instant Access to Expert-Tailored Solutions
See step-by-step solutions with expert insights and AI powered tools for academic success
Step: 2

Step: 3

Ace Your Homework with AI
Get the answers you need in no time with our AI-driven, step-by-step assistance
Get Started


