Answered step by step
Verified Expert Solution
Question
1 Approved Answer
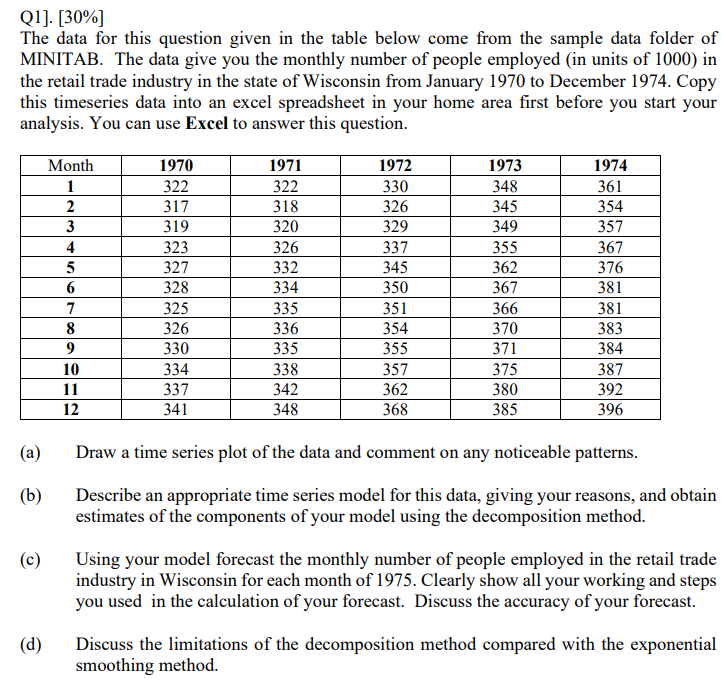
Q 1 ] . [ 3 0 % ] The data for this question given in the table below come from the sample data folder
Q
The data for this question given in the table below come from the sample data folder of
MINITAB. The data give you the monthly number of people employed in units of in
the retail trade industry in the state of Wisconsin from January to December Copy
this timeseries data into an excel spreadsheet in your home area first before you start your
analysis. You can use Excel to answer this question.
a Draw a time series plot of the data and comment on any noticeable patterns.
b Describe an appropriate time series model for this data, giving your reasons, and obtain
estimates of the components of your model using the decomposition method.
c Using your model forecast the monthly number of people employed in the retail trade
industry in Wisconsin for each month of Clearly show all your working and steps
you used in the calculation of your forecast. Discuss the accuracy of your forecast.
d Discuss the limitations of the decomposition method compared with the exponential
smoothing method.

Step by Step Solution
There are 3 Steps involved in it
Step: 1

Get Instant Access to Expert-Tailored Solutions
See step-by-step solutions with expert insights and AI powered tools for academic success
Step: 2

Step: 3

Ace Your Homework with AI
Get the answers you need in no time with our AI-driven, step-by-step assistance
Get Started


