Answered step by step
Verified Expert Solution
Question
1 Approved Answer
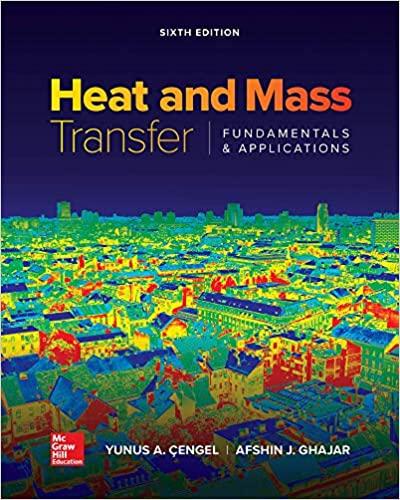
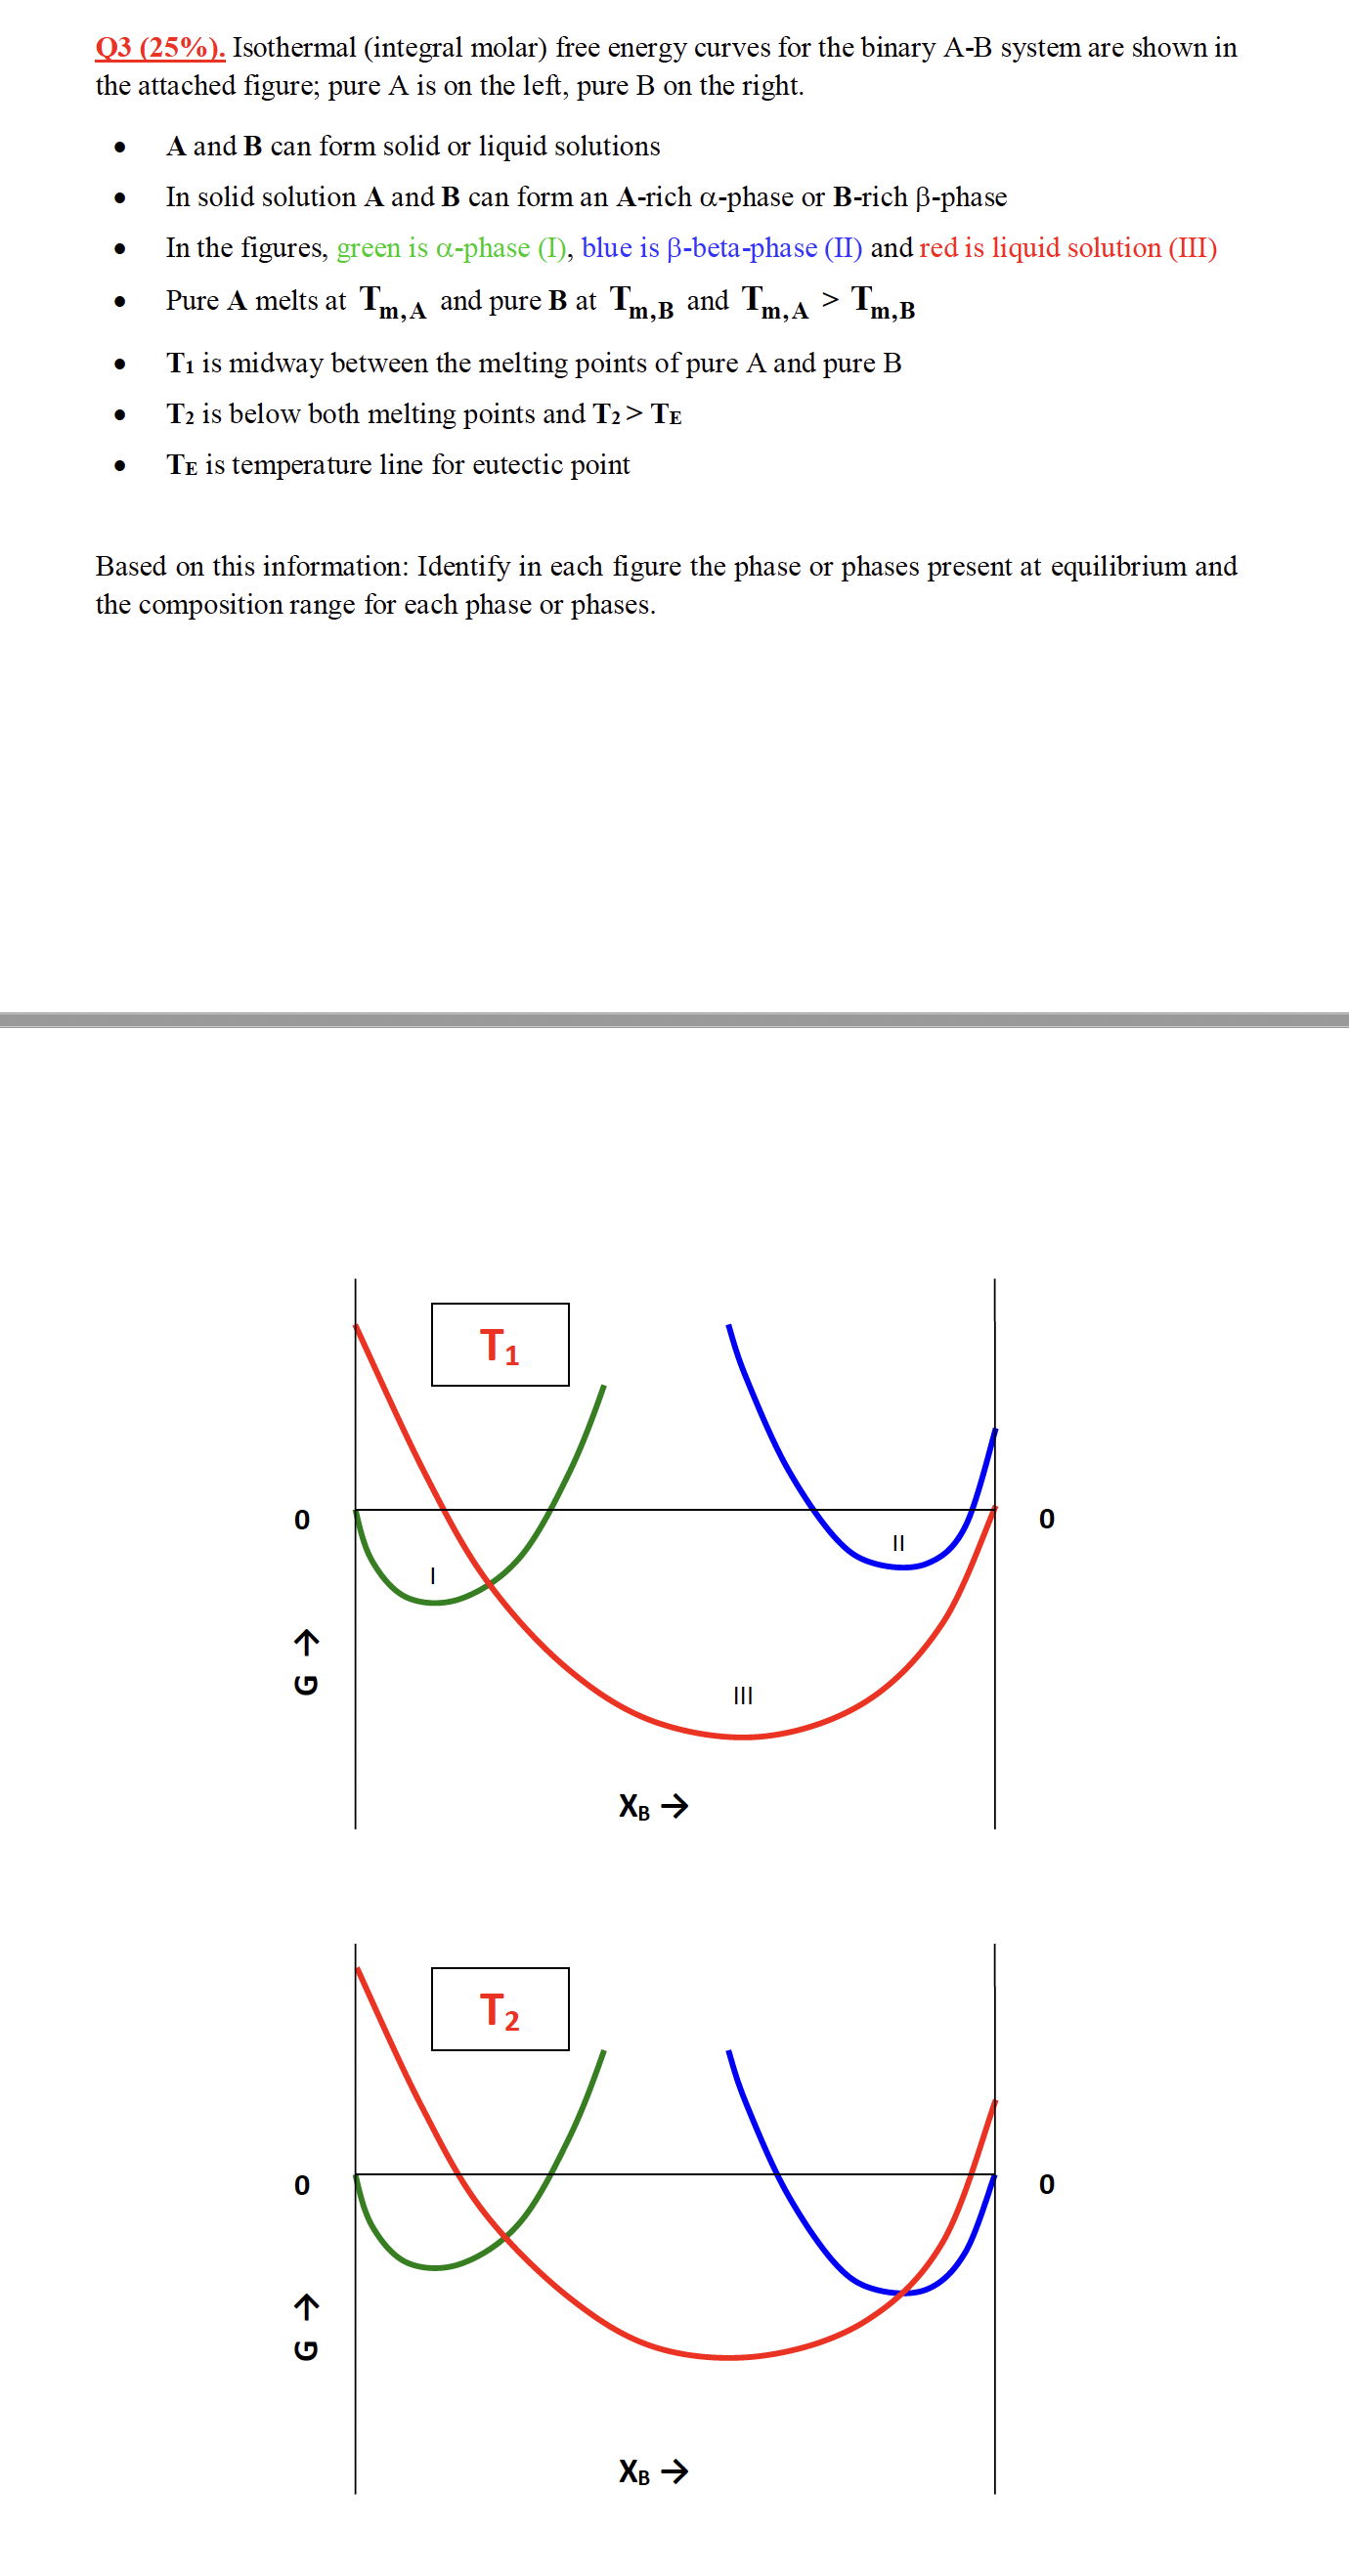
Q 3 ( 2 5 % ) . Isothermal ( integral molar ) free energy curves for the binary A - B system are shown
Q Isothermal integral molar free energy curves for the binary AB system are shown in
the attached figure; pure is on the left, pure on the right.
A and can form solid or liquid solutions
In solid solution A and can form an rich phase or rich phase
In the figures, green is phase I blue is betaphase II and red is liquid solution III
Pure A melts at and pure at and
is midway between the melting points of pure A and pure
is below both melting points and
is temperature line for eutectic point
Based on this information: Identify in each figure the phase or phases present at equilibrium and
the composition range for each phase or phases.
Step by Step Solution
There are 3 Steps involved in it
Step: 1

Get Instant Access to Expert-Tailored Solutions
See step-by-step solutions with expert insights and AI powered tools for academic success
Step: 2

Step: 3
Ace Your Homework with AI
Get the answers you need in no time with our AI-driven, step-by-step assistance
Get Started