Answered step by step
Verified Expert Solution
Question
1 Approved Answer
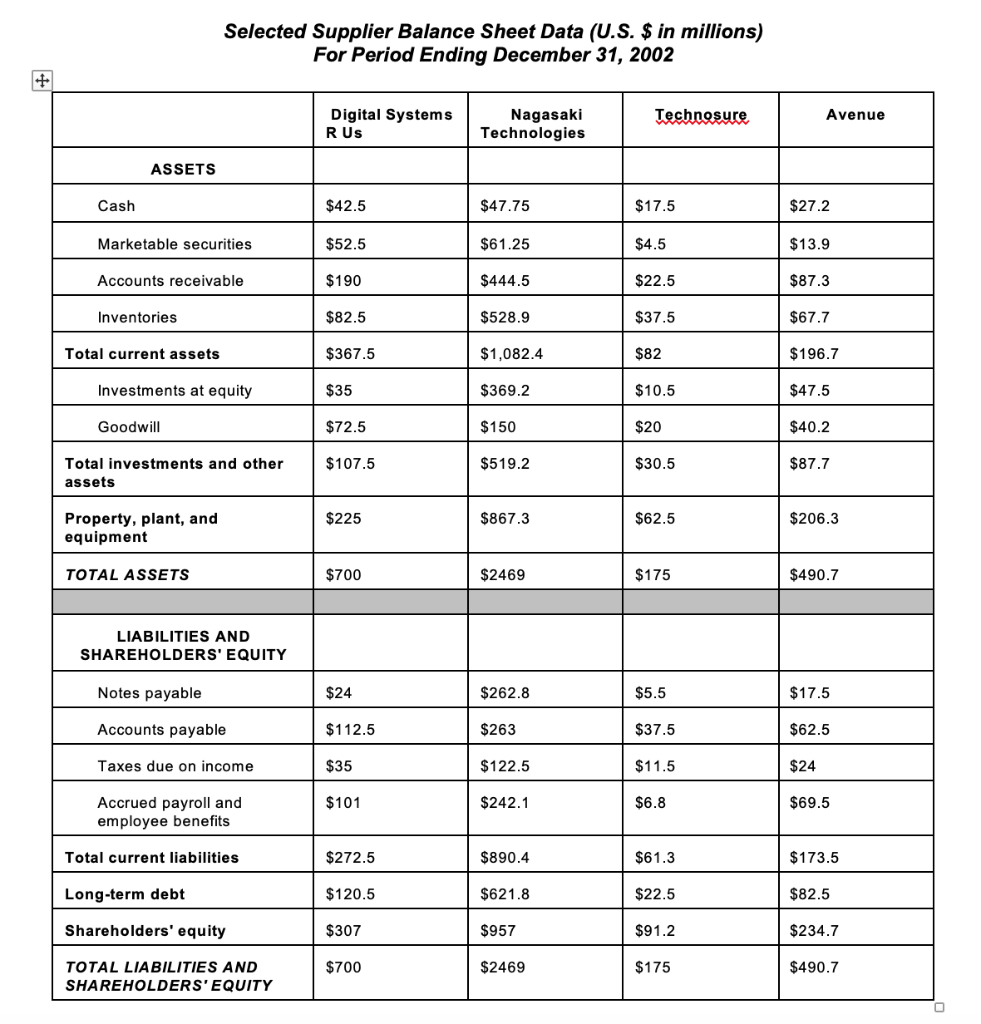
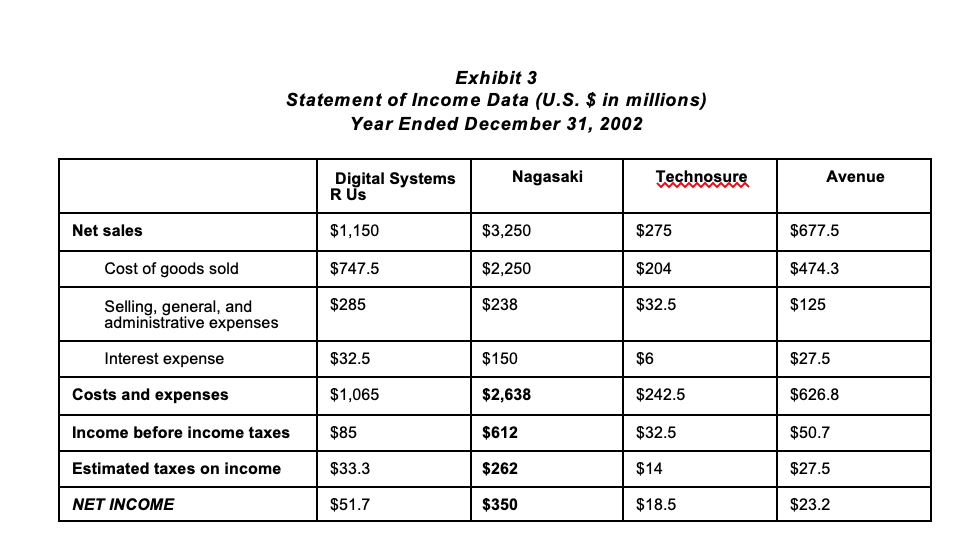
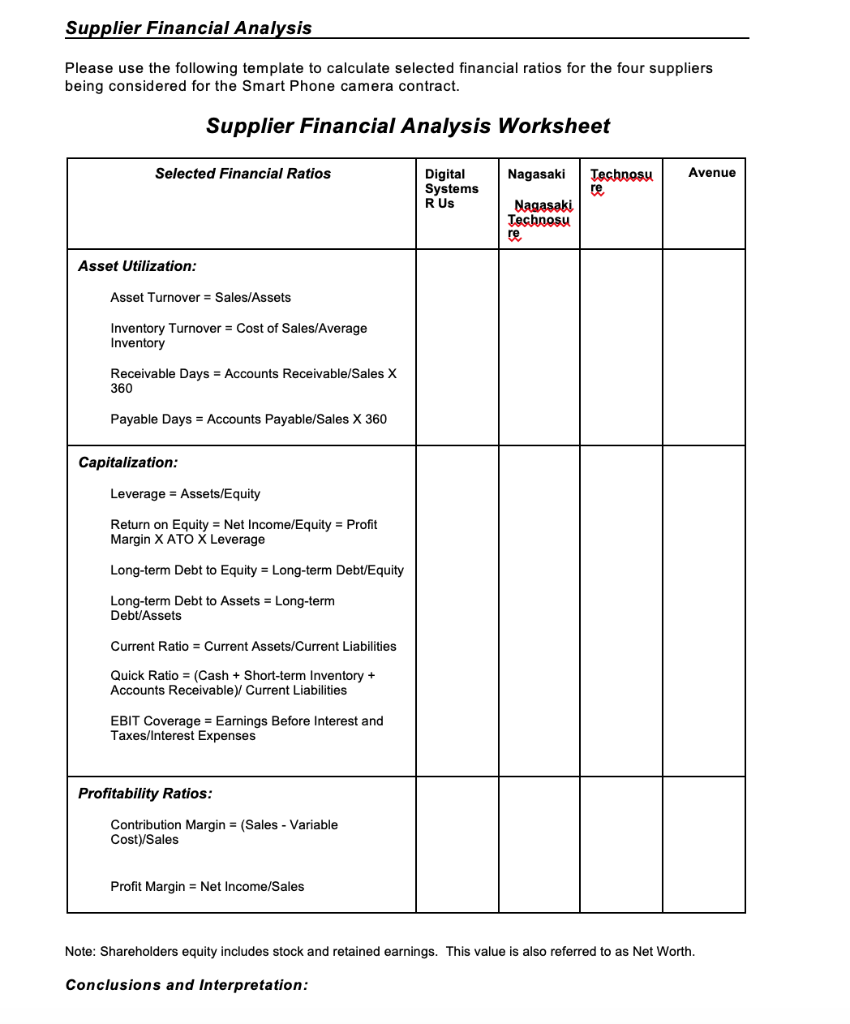
Q: Perform Financial Risk Analysis While this case assumes that the cross-functional team visited four suppliers, organizations often perform a preliminary financial risk analysis to


Q: Perform Financial Risk Analysis While this case assumes that the cross-functional team visited four suppliers, organizations often perform a preliminary financial risk analysis to identify the suppliers that may not warrant further consideration due to excessive financial risk.
Selected Supplier Balance Sheet Data (U.S. $ in millions) For Period Ending December 31, 2002 Digital Systems Nagasaki Technologies Avenue ASSETS $42.5 $52.5 $190 $82.5 $367.5 $35 $72.5 $107.5 $47.75 $61.25 $444.5 $528.9 $1,082.4 $369.2 $150 $519.2 $27.2 $13.9 $87.3 $67.7 $196.7 $47.5 $40.2 $87.7 as Marketable securities Accounts receivable Inventories $22.5 $37.5 $82 $10.5 $20 $30.5 Total current assets Investments at equity Goodwill Total investments and other assets $225 $867.3 $62.5 $206.3 Property, plant, and equipment TOTAL ASSETS $700 $2469 $175 $490.7 LIABILITIES AND SHAREHOLDERS' EQUITY Notes payable Accounts payable Taxes due on income Accrued payroll and $24 $112.5 $35 $101 $262.8 $263 $122.5 $242.1 $17.5 $62.5 $24 $69.5 $37.5 $6.8 employee benefits Total current liabilities Long-term debt Shareholders' equity TOTAL LIABILITIES AND $272.5 $120.5 $307 $700 $890.4 $621.8 $957 $2469 $61.3 $22.5 $91.2 $175 $173.5 $82.5 $234.7 $490.7 SHAREHOLDERS EQUITY Exhibit 3 Statement of Income Data (U.S. $ in millions) Year Ended December 31, 2002 Digital Systems Nagasaki Avenue Net sales $1,150 $747.5 $285 $3,250 $2,250 $238 $275 $204 $32.5 $677.5 $474.3 $125 Cost of goods sold Selling, general, and administrative expenses Interest expense $32.5 Costs and expenses Income before income taxes$85 Estimated taxes on income NET INCOME $150 $2,638 $612 $262 $350 $6 $242.5 $32.5 $14 $18.5 $27.5 $626.8 $50.7 $27.5 $23.2 $1,065 $33.3 $51.7 Supplier Financial Analysis Please use the following template to calculate selected financial ratios for the four suppliers being considered for the Smart Phone camera contract. Supplier Financial Analysis Worksheet Digital Systems R Us Selected Financial Ratios NagasakiTeshnosu Avenue re Nagasaki Tecbnosuu re Asset Utilization Asset Turnover Sales/Assets Inventory Turnover Inventory Cost of Sales/Average Receivable Days Accounts Receivable/Sales X 360 Payable Days Accounts Payable/Sales X 360 Capitalization Leverage Assets/Equity Return on Equity Net Income/Equity Profit Margin X ATO X Leverage Long-term Debt to Equity = Long-term Debt/Equity Long-term Debt to Assets Long-term Debt/Assets Current Ratio Current Assets/Current Liabilities Quick Ratio (CashShort-term Inventory+ Accounts Receivable Current Liabilities EBIT Coverage = Earnings Before Interest and Taxes/Interest Expenses Profitability Ratios Contribution Margin (Sales-Variable Cost)/Sales Profit Margin Net Income/Sales Note: Shareholders equity includes stock and retained earnings. This value is also referred to as Net Worth. Conclusions and Interpretation Selected Supplier Balance Sheet Data (U.S. $ in millions) For Period Ending December 31, 2002 Digital Systems Nagasaki Technologies Avenue ASSETS $42.5 $52.5 $190 $82.5 $367.5 $35 $72.5 $107.5 $47.75 $61.25 $444.5 $528.9 $1,082.4 $369.2 $150 $519.2 $27.2 $13.9 $87.3 $67.7 $196.7 $47.5 $40.2 $87.7 as Marketable securities Accounts receivable Inventories $22.5 $37.5 $82 $10.5 $20 $30.5 Total current assets Investments at equity Goodwill Total investments and other assets $225 $867.3 $62.5 $206.3 Property, plant, and equipment TOTAL ASSETS $700 $2469 $175 $490.7 LIABILITIES AND SHAREHOLDERS' EQUITY Notes payable Accounts payable Taxes due on income Accrued payroll and $24 $112.5 $35 $101 $262.8 $263 $122.5 $242.1 $17.5 $62.5 $24 $69.5 $37.5 $6.8 employee benefits Total current liabilities Long-term debt Shareholders' equity TOTAL LIABILITIES AND $272.5 $120.5 $307 $700 $890.4 $621.8 $957 $2469 $61.3 $22.5 $91.2 $175 $173.5 $82.5 $234.7 $490.7 SHAREHOLDERS EQUITY Exhibit 3 Statement of Income Data (U.S. $ in millions) Year Ended December 31, 2002 Digital Systems Nagasaki Avenue Net sales $1,150 $747.5 $285 $3,250 $2,250 $238 $275 $204 $32.5 $677.5 $474.3 $125 Cost of goods sold Selling, general, and administrative expenses Interest expense $32.5 Costs and expenses Income before income taxes$85 Estimated taxes on income NET INCOME $150 $2,638 $612 $262 $350 $6 $242.5 $32.5 $14 $18.5 $27.5 $626.8 $50.7 $27.5 $23.2 $1,065 $33.3 $51.7 Supplier Financial Analysis Please use the following template to calculate selected financial ratios for the four suppliers being considered for the Smart Phone camera contract. Supplier Financial Analysis Worksheet Digital Systems R Us Selected Financial Ratios NagasakiTeshnosu Avenue re Nagasaki Tecbnosuu re Asset Utilization Asset Turnover Sales/Assets Inventory Turnover Inventory Cost of Sales/Average Receivable Days Accounts Receivable/Sales X 360 Payable Days Accounts Payable/Sales X 360 Capitalization Leverage Assets/Equity Return on Equity Net Income/Equity Profit Margin X ATO X Leverage Long-term Debt to Equity = Long-term Debt/Equity Long-term Debt to Assets Long-term Debt/Assets Current Ratio Current Assets/Current Liabilities Quick Ratio (CashShort-term Inventory+ Accounts Receivable Current Liabilities EBIT Coverage = Earnings Before Interest and Taxes/Interest Expenses Profitability Ratios Contribution Margin (Sales-Variable Cost)/Sales Profit Margin Net Income/Sales Note: Shareholders equity includes stock and retained earnings. This value is also referred to as Net Worth. Conclusions and Interpretation
Step by Step Solution
There are 3 Steps involved in it
Step: 1

Get Instant Access to Expert-Tailored Solutions
See step-by-step solutions with expert insights and AI powered tools for academic success
Step: 2

Step: 3

Ace Your Homework with AI
Get the answers you need in no time with our AI-driven, step-by-step assistance
Get Started


